Explore 10+ Finance Dashboard Examples & Templates
Discover real-world finance dashboard examples built for CFOs, finance teams, and business owners. From P&L tracking to cash flow analysis, find a template that fits your data and business.
Explore Examples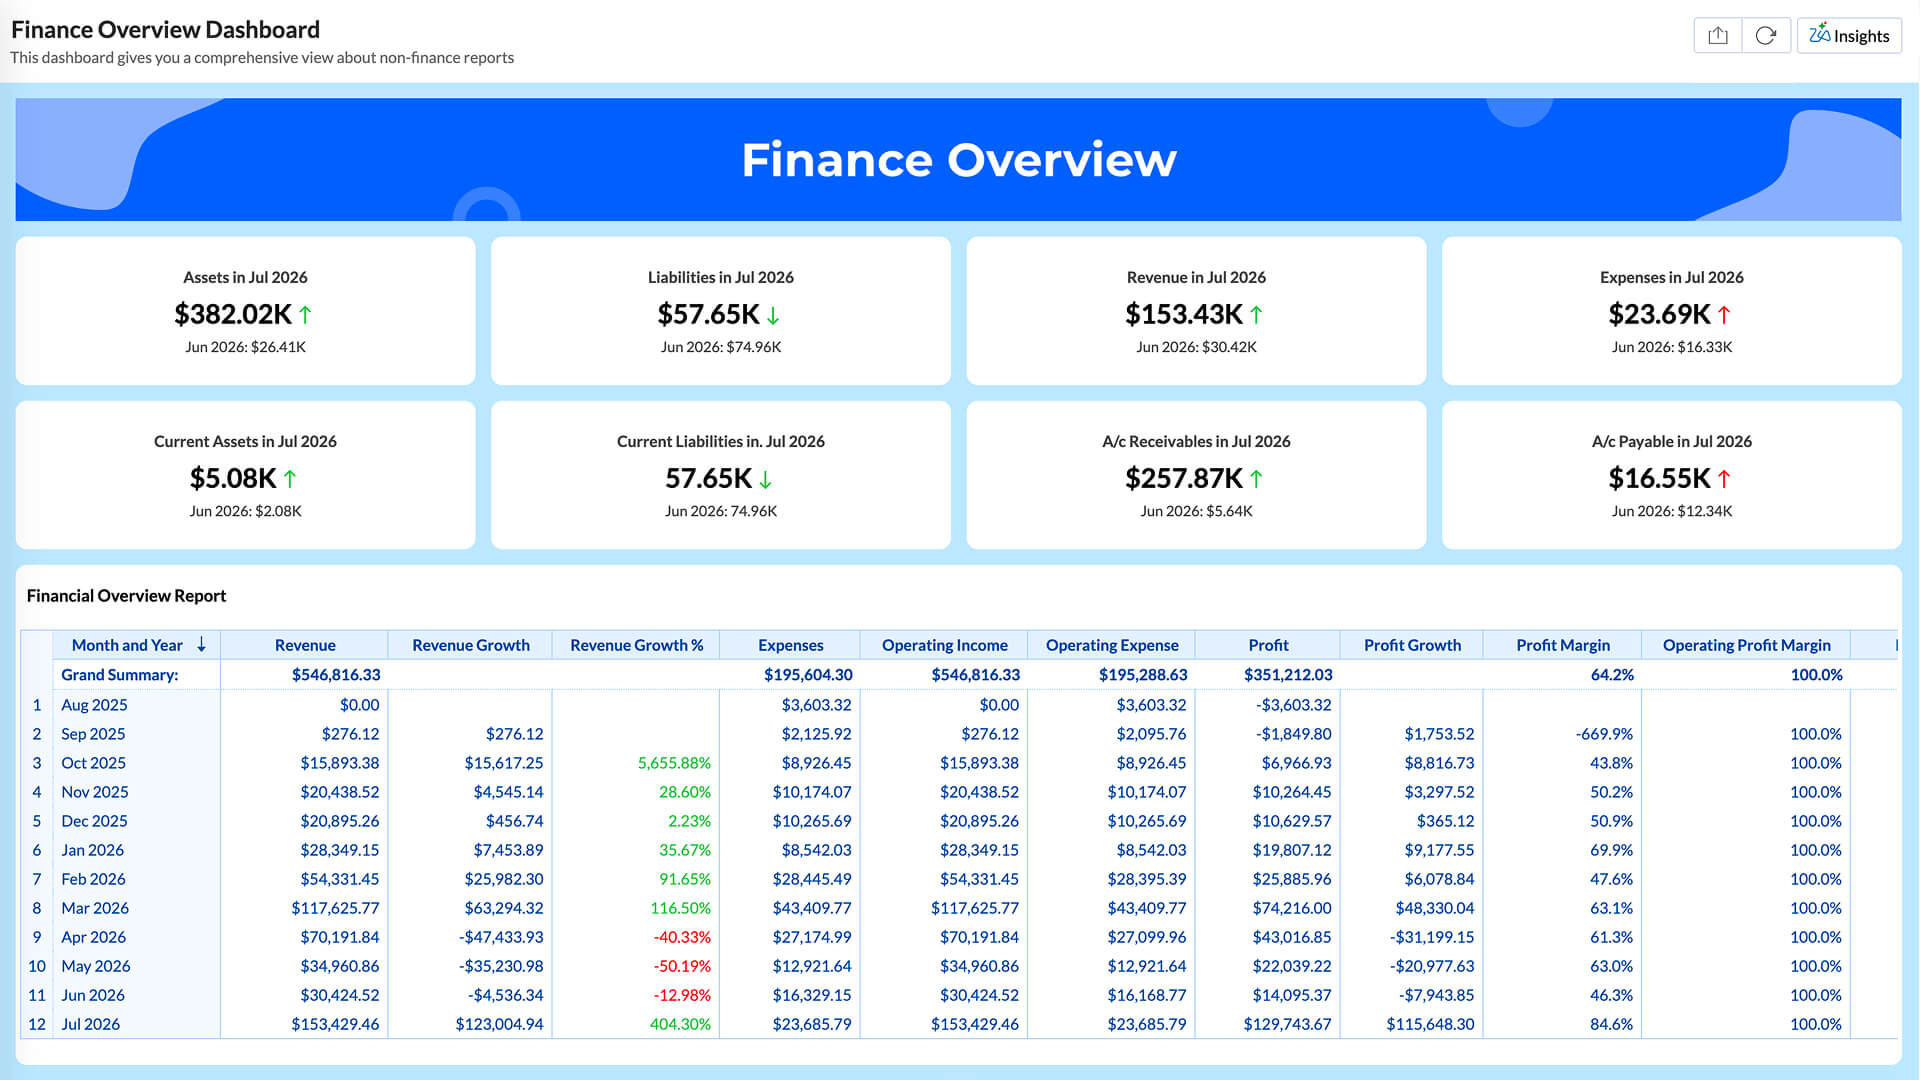
- 16K
Customers
- 3M
Users
Finance Dashboard Examples by Type
From cash flow tracking to subscription billing, find finance dashboard examples that fit how your team works with data.
Finance overview dashboard
Get a complete picture of your financial health in one screen. Track assets, liabilities, revenue, and expenses side by side with month-over-month comparisons and a detailed financial overview report underneath.
- Total assets
- Total liabilities
- Revenue
- Expenses
- Current assets
- Current liabilities
- Accounts receivable
- Accounts payable
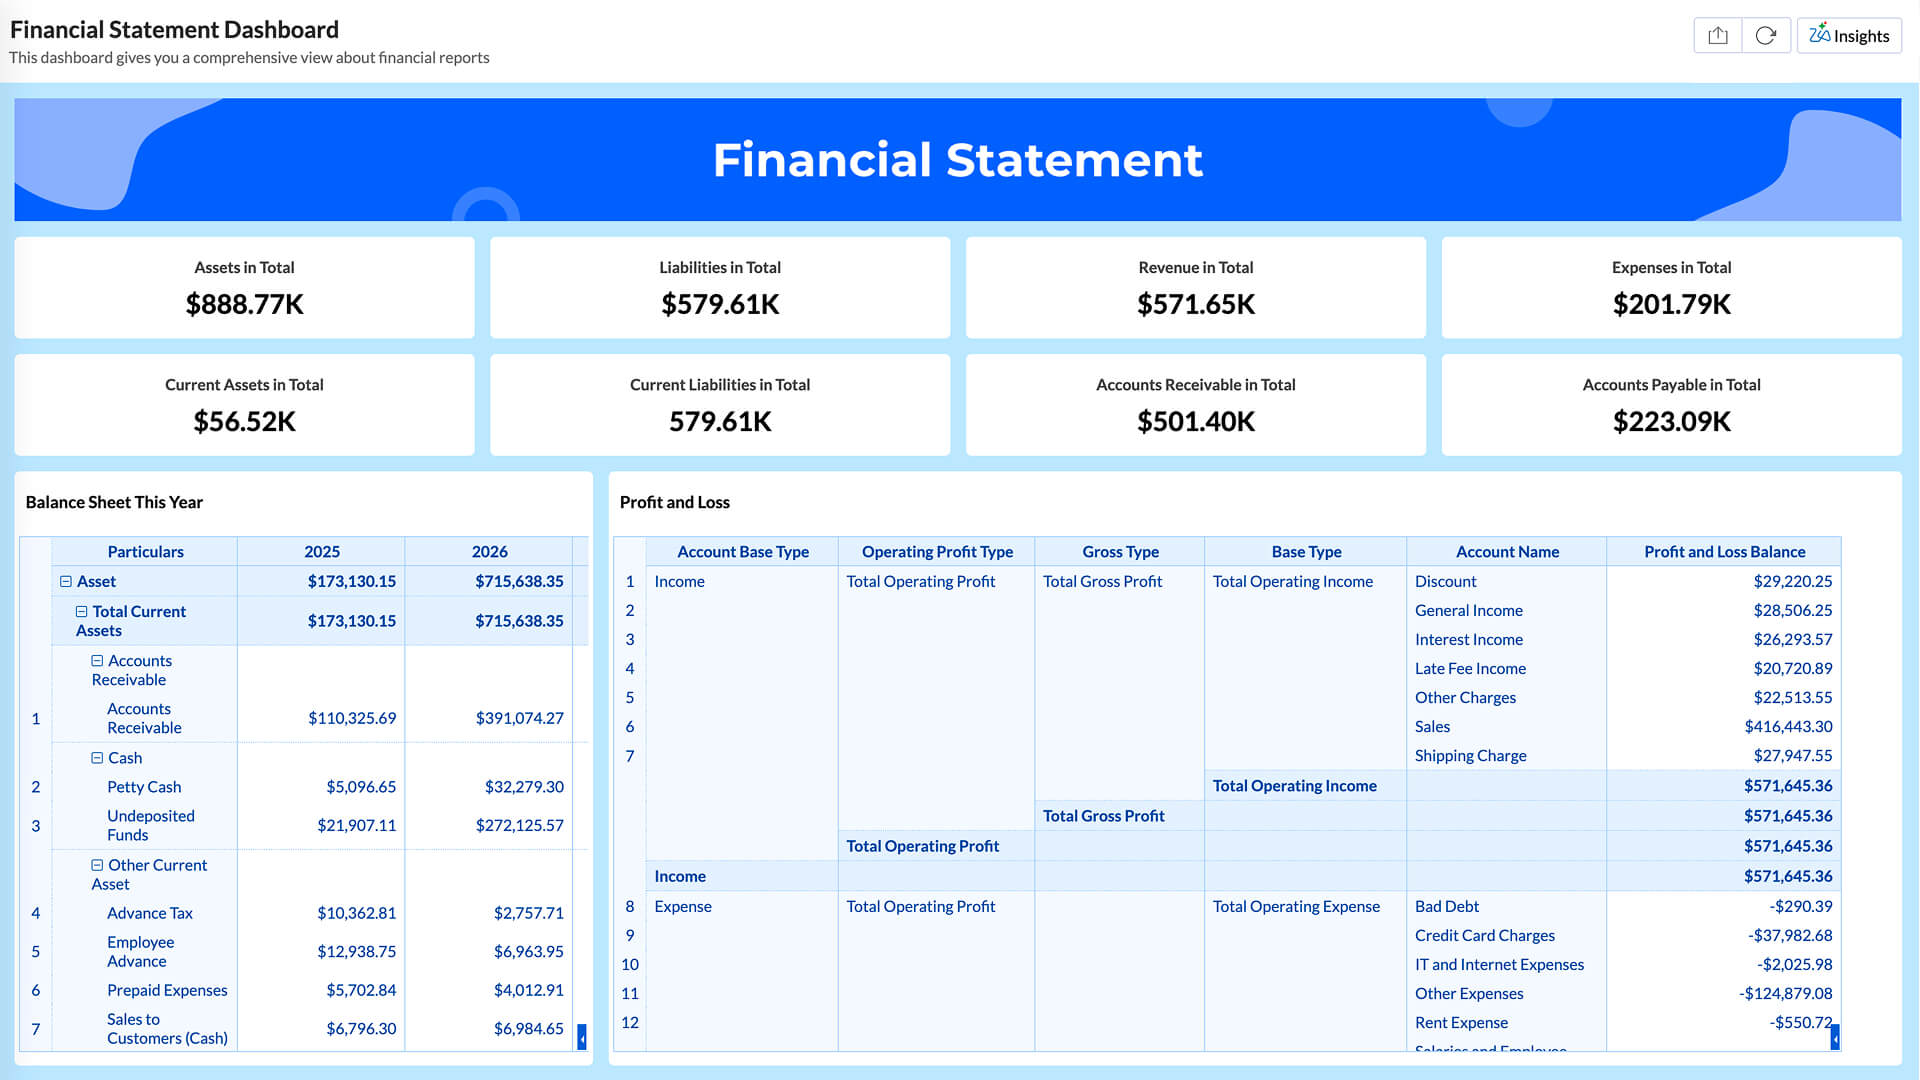
Financial statement dashboard
A structured view of your balance sheet and income data across time periods. Compare year-over-year figures for assets, equity, and liabilities without manually pulling statements from your accounting tool.
- Total assets
- Total liabilities
- Total revenue
- Total expenses
- Accounts receivable
- Accounts payable
- Balance sheet (current year vs prior year)
Purchases and payables dashboard
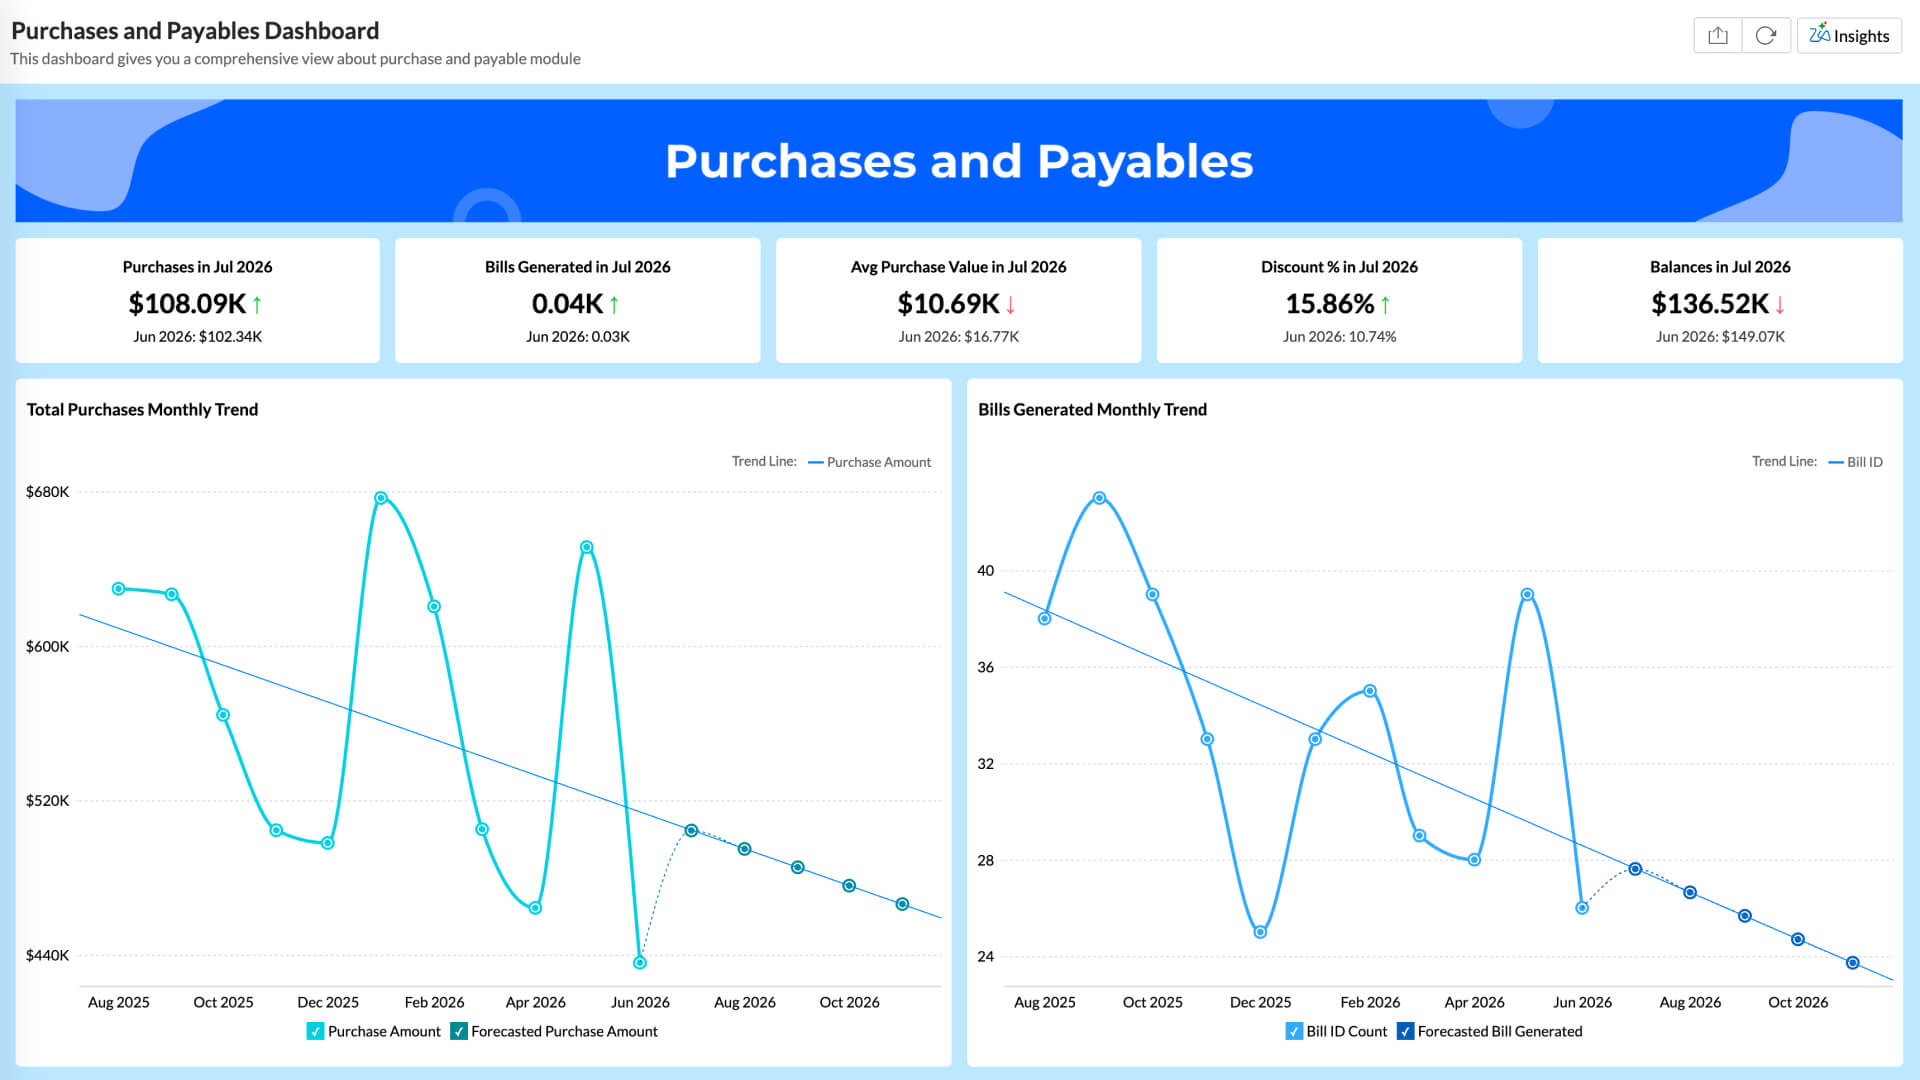
Monitor your procurement spend, vendor bills, and outstanding balances over time. Spot purchase volume trends, track discount utilization, and keep tabs on aging invoices before they become a cash flow problem.
- Total purchases
- Bills generated
- Average purchase value
- Discount %
- Outstanding balances
- Purchase trend (actual vs forecast)
- Bills by status
Sales and receivables dashboard
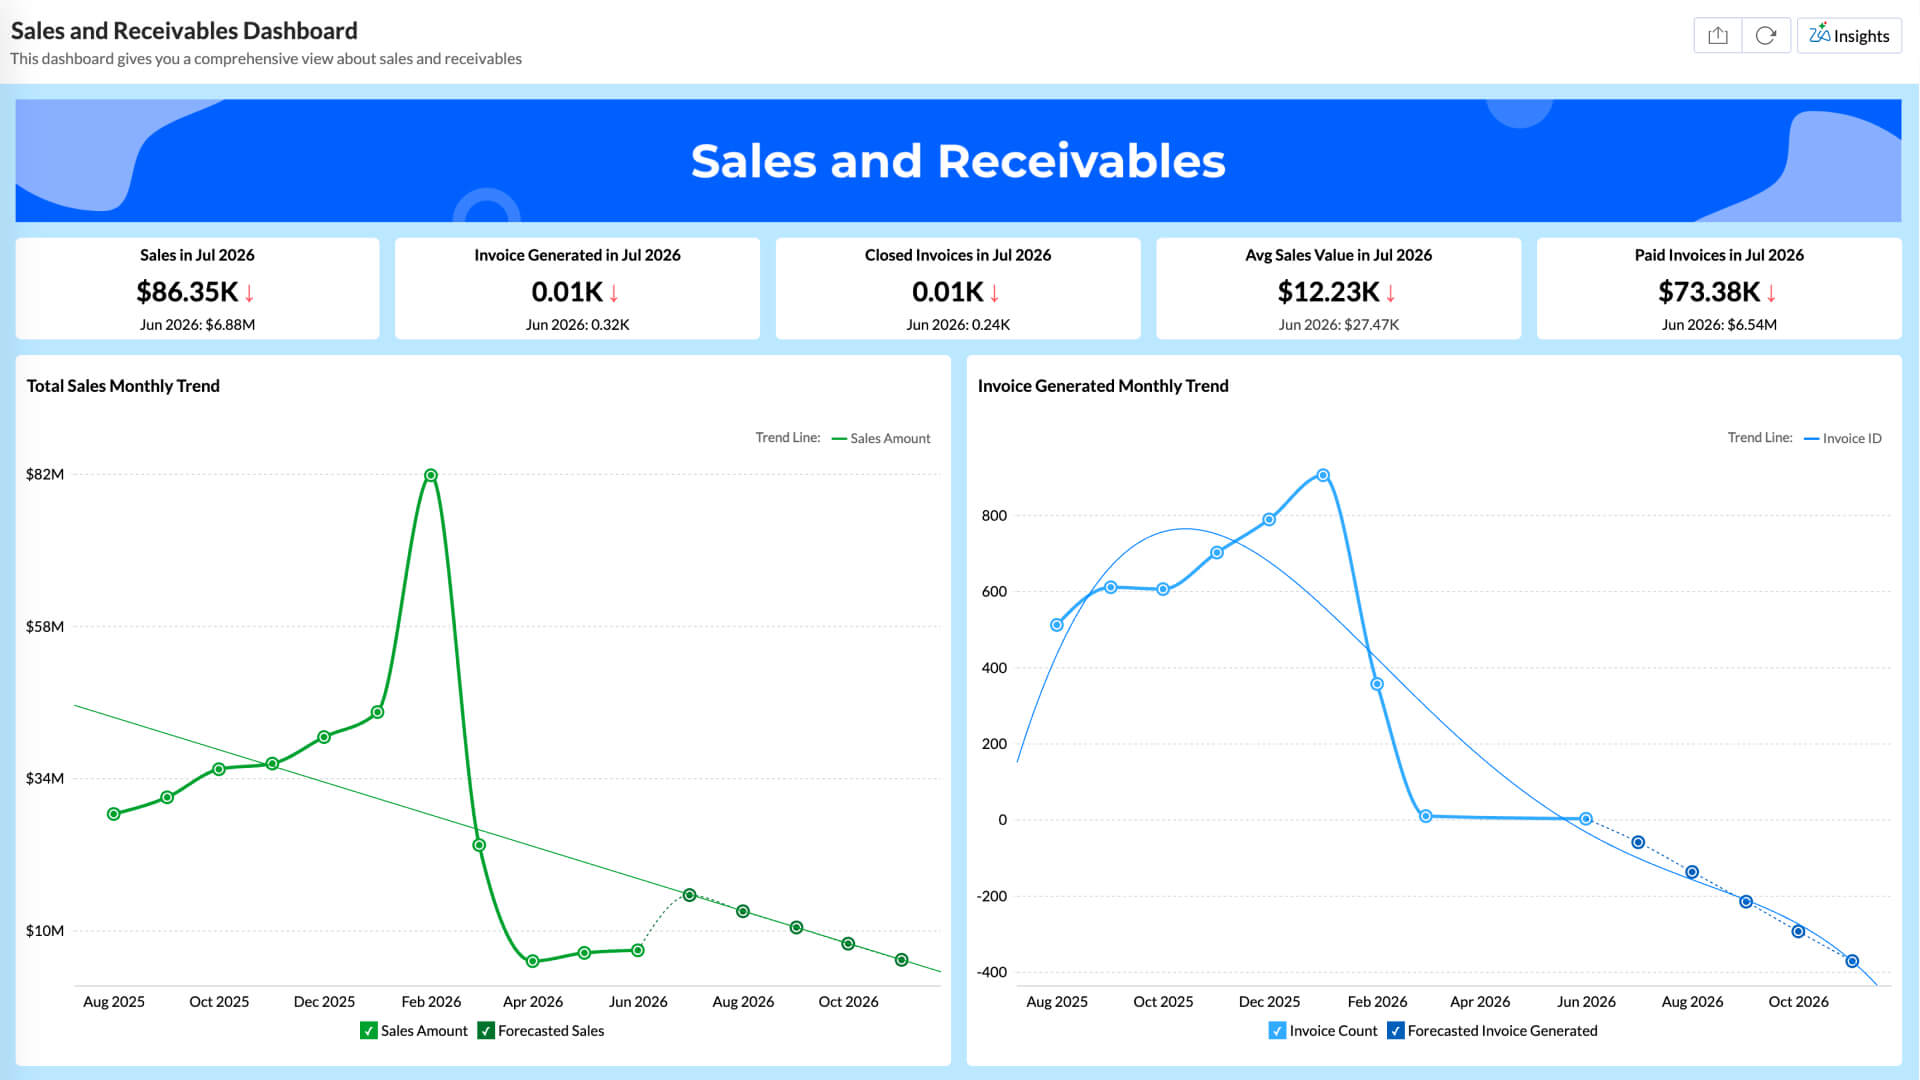
Track invoiced revenue, collections, and overdue accounts in one place. See how your sales trend month over month alongside invoice generation rates, and quickly identify where receivables are falling behind.
- Total sales
- Invoices generated
- Closed invoices
- Average sales value
- Paid invoices
- Sales trend (actual vs forecast)
- Invoice status breakdown
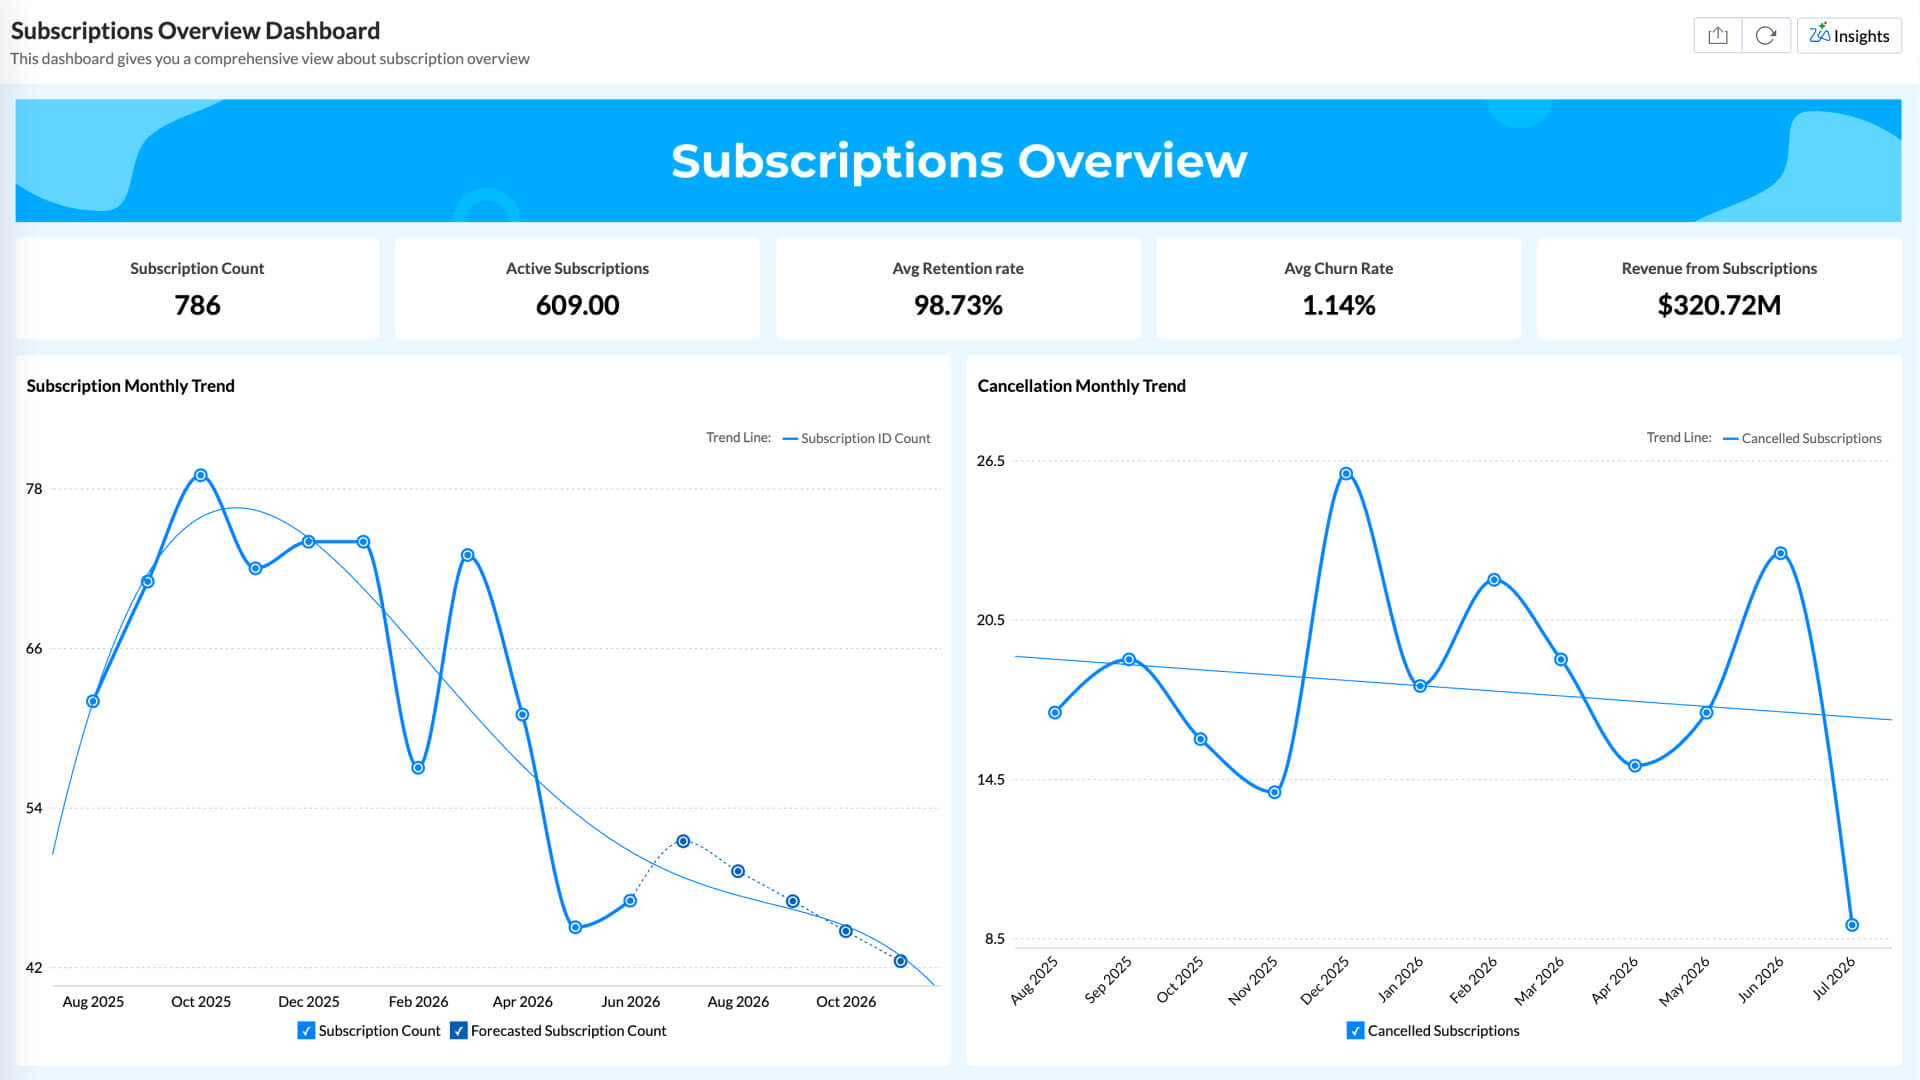
Subscriptions overview dashboard
Keep a pulse on your subscription business: active customers, new signups, cancellations, and average customer lifetime. Spot growth slowdowns early and understand which plans are driving retention.
- Active subscriptions
- Active customers
- Average customer lifetime
- Monthly LTV
- New subscriptions
- Cancellations
- New customers this month
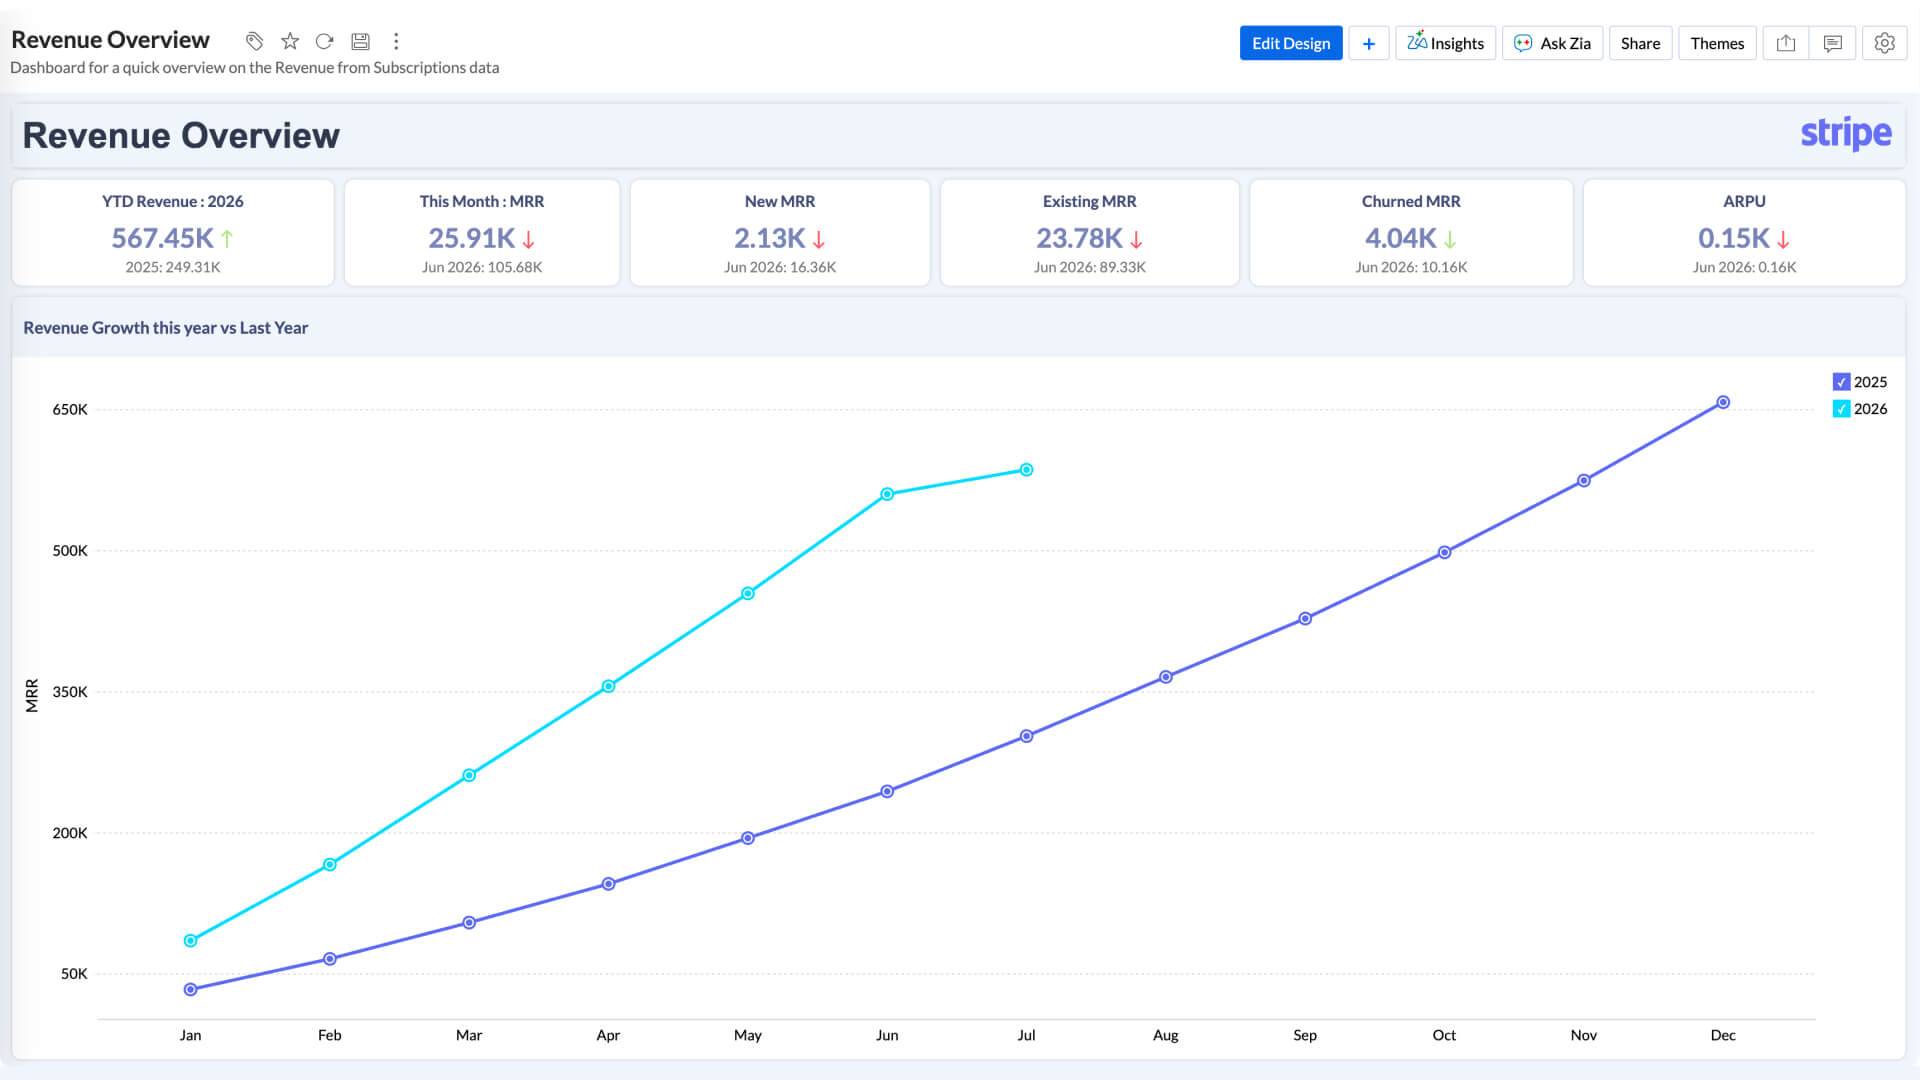
Revenue overview dashboard
Dig into the revenue numbers behind your subscription growth. Compare MRR year over year, track new versus existing revenue, and monitor churn impact on your recurring revenue baseline.
- YTD revenue
- Monthly recurring revenue (MRR)
- New MRR
- Existing MRR
- Churned MRR
- ARPU
- Revenue growth (this year vs last year)
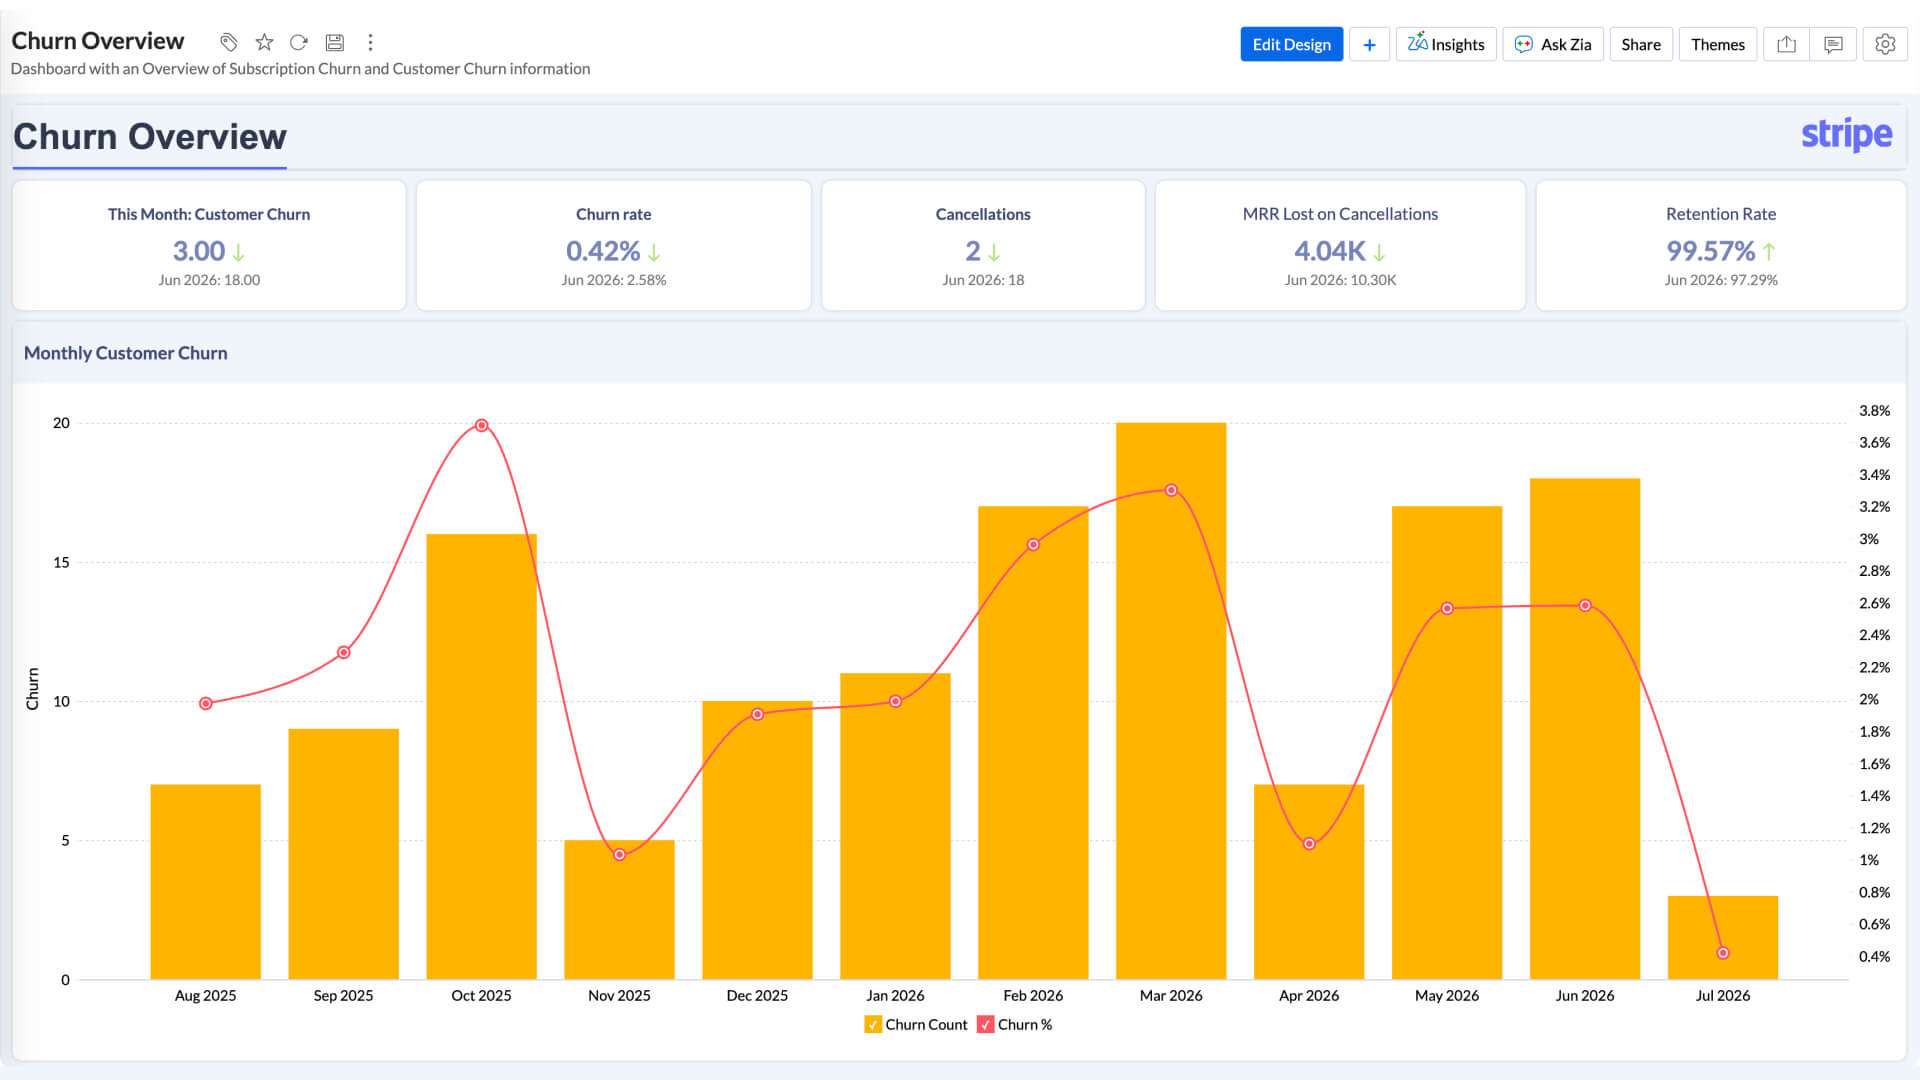
Churn overview dashboard
Understand exactly where and when you're losing customers. Track churn rate, cancellations, and MRR lost month by month, so your team can act before retention problems compound.
- Customer churn
- Churn rate
- Cancellations
- MRR lost on cancellations
- Retention rate
- Monthly churn trend
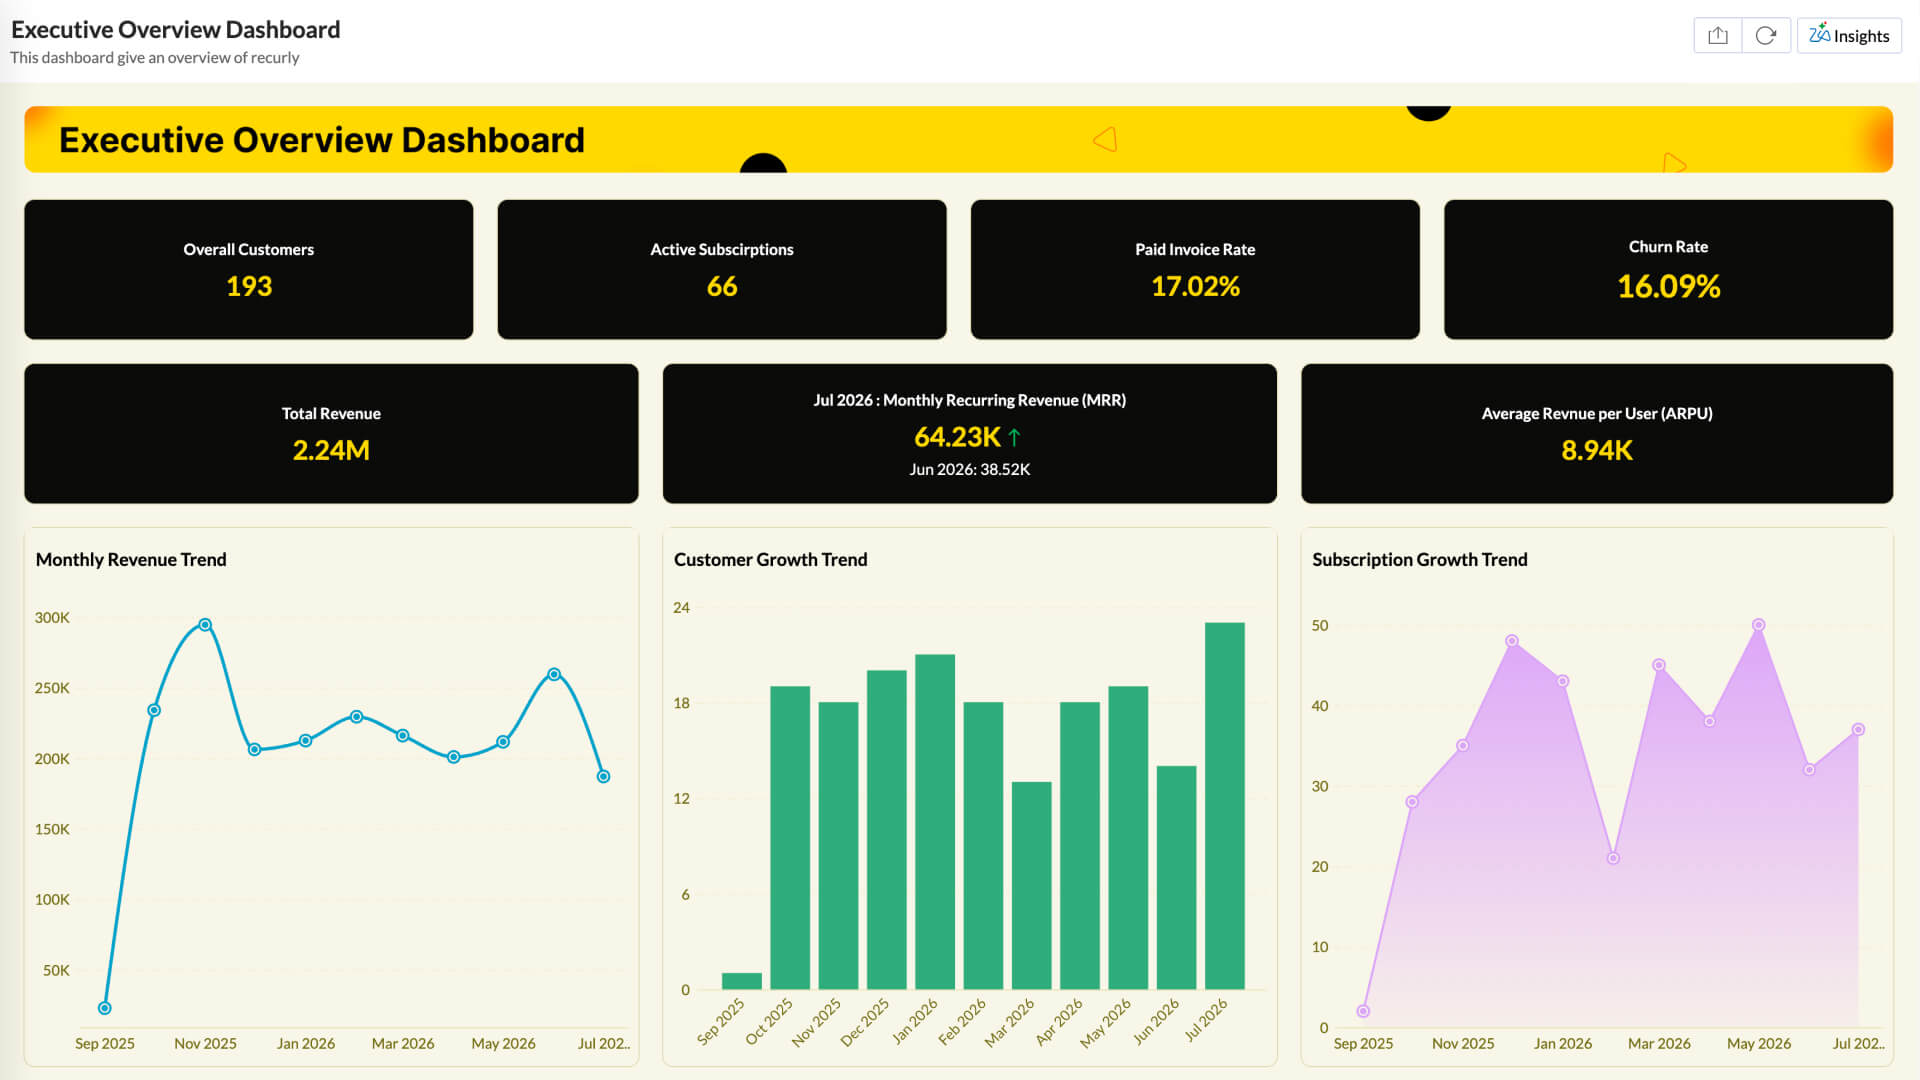
Executive overview dashboard
A high-level view built for leadership. Combines customer count, subscription activity, revenue, and churn into one clean screen, so executives can assess business health without digging into multiple reports.
- Total customers
- Active subscriptions
- Paid invoice rate
- Churn rate
- Total revenue
- MRR
- ARPU
- Monthly revenue trend
- Customer growth trend
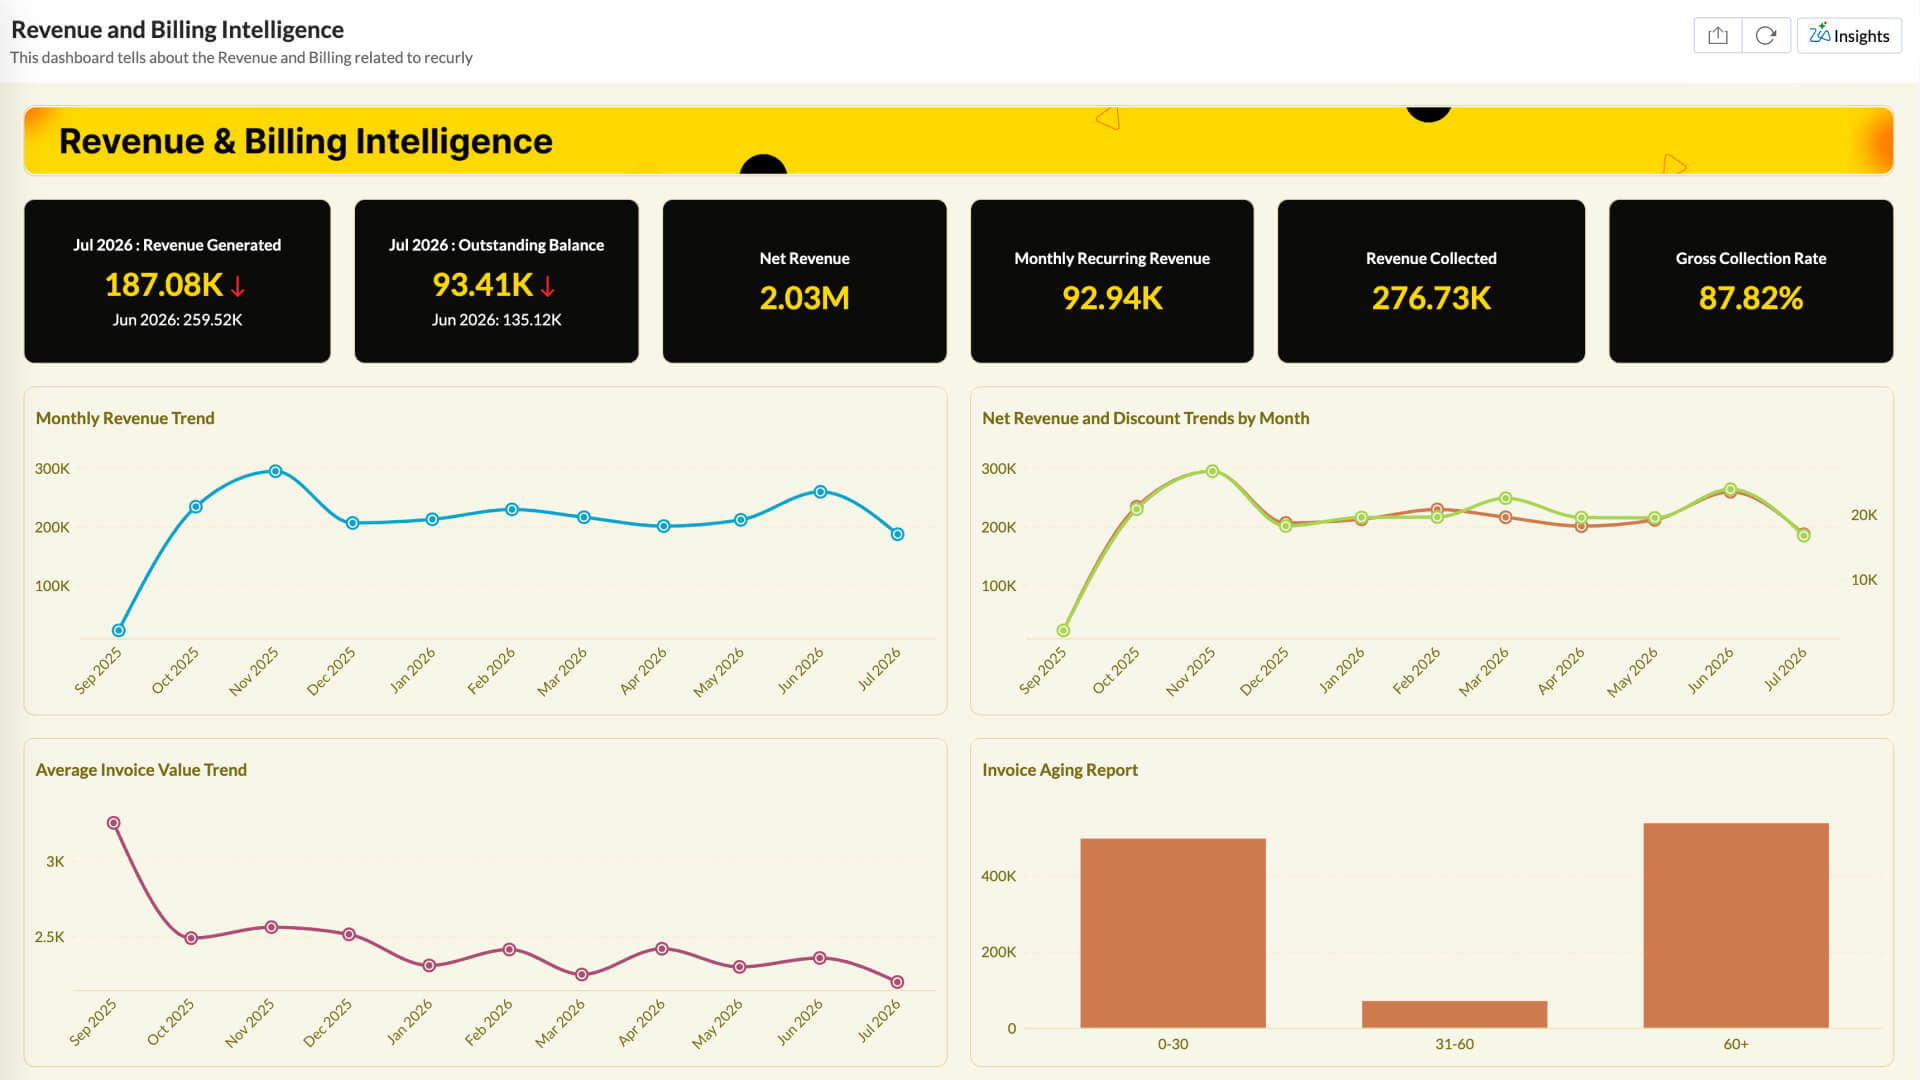
Revenue and billing intelligence dashboard
Go deeper than top-line revenue. This dashboard breaks down collected revenue, outstanding balances, net revenue, and invoice aging, giving your finance team full visibility into billing performance and collection efficiency.
- Revenue generated
- Outstanding balance
- Net revenue
- MRR
- Revenue collected
- Gross collection rate
- Average invoice value
- Invoice aging report
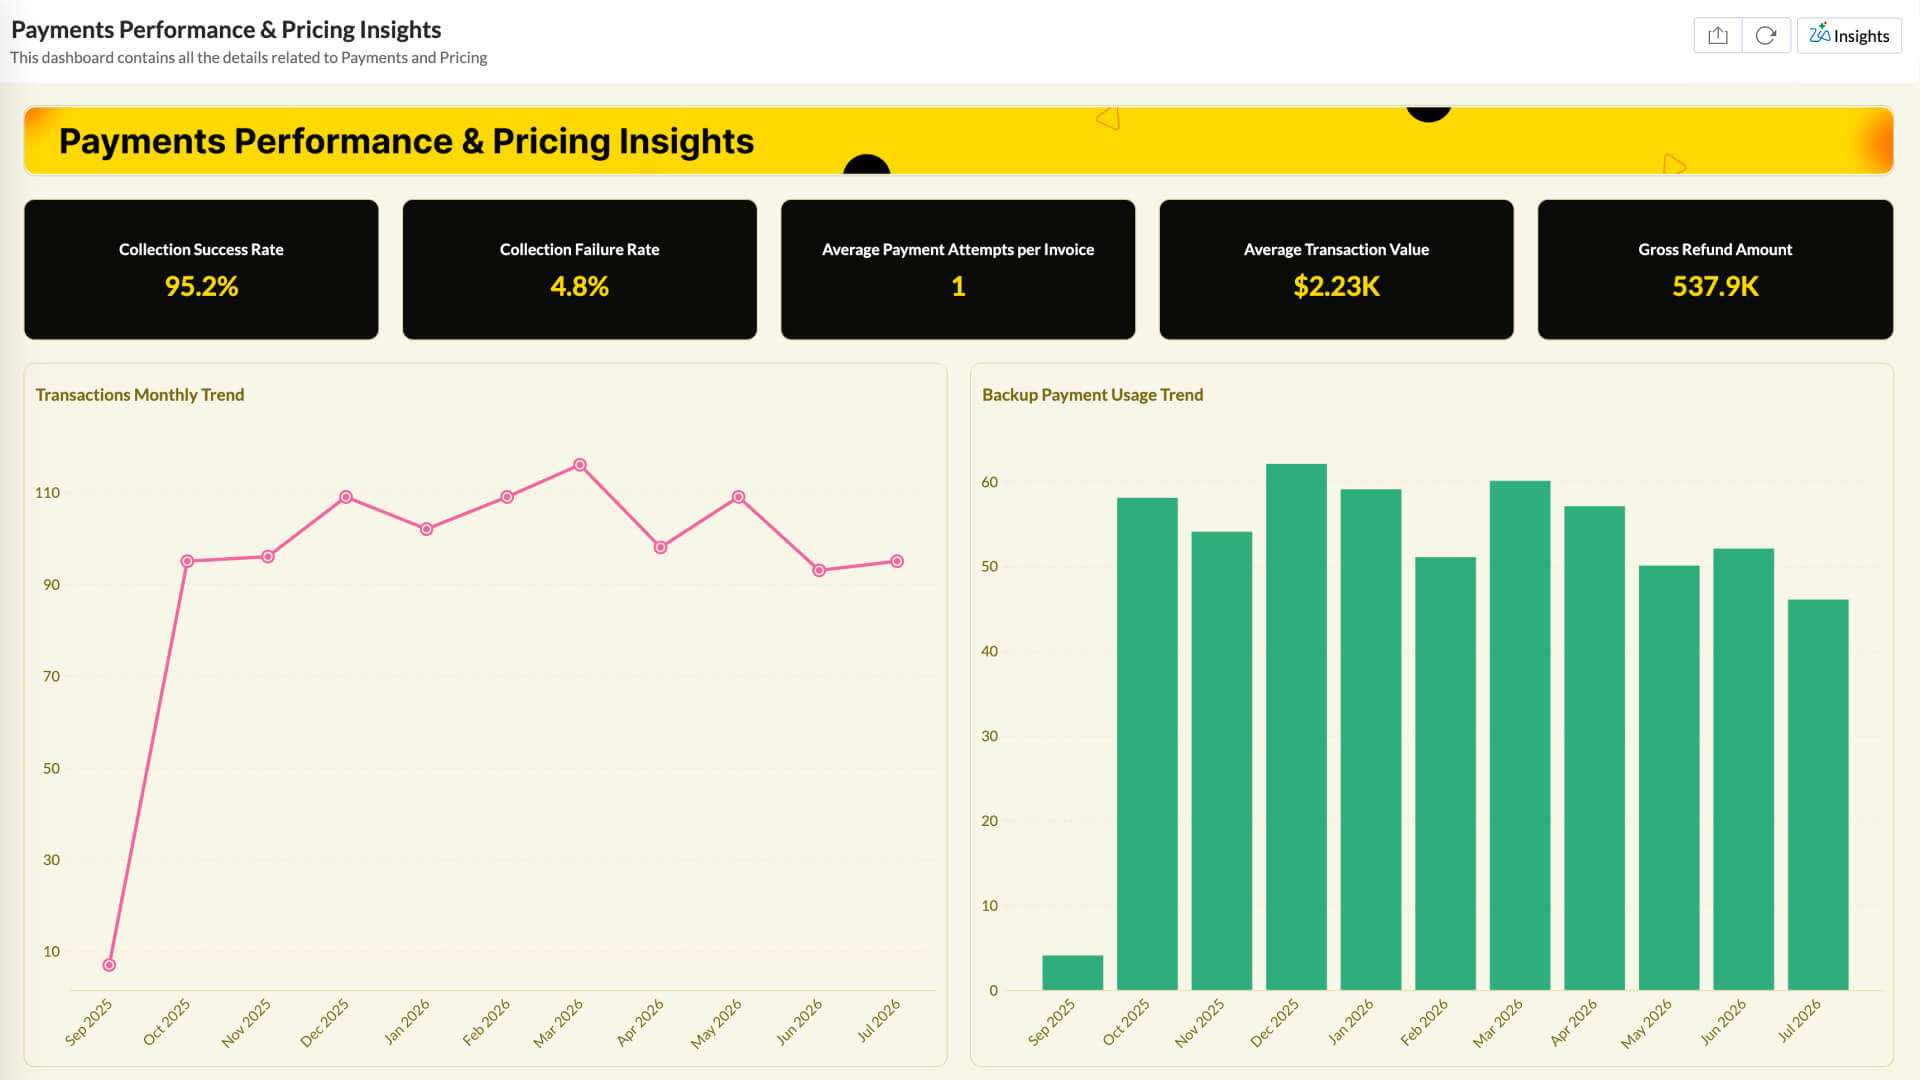
Payments performance and pricing insights dashboard
Track payment collection success, failure rates, and transaction patterns across your billing infrastructure. Identify which payment methods and gateways perform best, and where failed payments are costing you revenue.
- Collection success rate
- Collection failure rate
- Average payment attempts per invoice
- Average transaction value
- Gross refund amount
- Payment method split
- Failure reason distribution
Connect popular finance tools you already use
Zoho Analytics is finance dashboard software that integrates with the platforms your finance team relies on every day. Get these financial dashboards generated prebuilt for you as soon as you connect your finance tools.

Zoho Finance
Connect Zoho Books, Inventory, Billing, Invoice, Expense, Payroll, and ERP to Zoho Analytics and get a unified view of your entire finance operation without switching between apps.

QuickBooks
Pull your QuickBooks accounting data into Zoho Analytics to build finance dashboards that go beyond what QuickBooks reports natively support.

Xero
Sync Xero with Zoho Analytics to analyze P&L, cash flow, and balance sheet data with more flexibility and deeper cross-period comparisons.

Stripe
Connect your Stripe account to track payment volume, transaction trends, failed charges, and revenue growth in one live dashboard.

PayPal
Import PayPal transaction data into Zoho Analytics to monitor payment activity, refunds, and revenue patterns across your billing cycles.

TallyPrime
Bring your TallyPrime accounting data into Zoho Analytics to visualize ledger entries, expenses, and financial summaries without manual exports.

Odoo
Connect Odoo to Zoho Analytics and build finance dashboards that pull data from across your Odoo modules, like accounting, invoicing, and more.

Recurly
Sync Recurly subscription and billing data with Zoho Analytics to track MRR, churn, cancellations, and revenue trends in real time.

Freshbooks
Connect Freshbooks to Zoho Analytics to analyze invoices, expenses, and client billing data, and turn them into clear financial reports.
How to build a finance dashboard using Zoho Analytics
Your accounting data is already there. Zoho Analytics turns it into dashboards your whole finance team can act on.
Connect your accounting and finance tools
Link Zoho Books, QuickBooks, Xero, Stripe, or any other finance tool your team runs on. Data flows in automatically on a set schedule without no manual refreshes.
Start with prebuilt finance dashboards
Pick from a library of ready-made dashboards covering P&L, cash flow, balance sheets, receivables, and more. Your data populates them the moment your source is connected.
Tailor dashboards to match your reporting needs
Create dashboards with metrics that matter to your finance team. Adjust layouts, apply filters by account, time period, or cost center, and combine data from multiple sources into a single view.
Share dashboards to the right people securely
Give your CFO, accounting team, or board members access to the live, interactive dashboards they need. Set view or edit permissions per user and schedule automated reports to land in their inbox.
Hear from our customers

Simone Drera
VP-Business Development, Flexxaire Inc."We wanted a simple BI solution to analyze our sales, project, and quality data. The tool also needed to be capable of integrating multiple tables, creating models to create charts that could be shared seamlessly across teams."

Moises Ochoa
Application Engineer, Cementos Progreso"With Zoho Analytics, the time spent in creating charts, reports and dashboards went down by 50%. More importantly, our software expenses were reduced by 30%!"

Marc Andrew
Senior Developer, Rental Car Manager"Our main alternate would have been Power BI, but we quickly found that the pricing and user-friendliness wouldn't quite work for a lot of our customers."
Frequently asked questions
What is a finance dashboard?
- A finance dashboard is a live visual report that pulls data from your accounting tools and displays key metrics, such as revenue, expenses, cash flow, liabilities, in one place. It replaces the need to manually compile numbers from multiple sources every time someone needs an update.
What should a finance dashboard include?
- Total revenue, total expenses, net profit, cash flow, and accounts receivable vs payable. Some finance teams also add budget vs actual, profit margin, and period-over-period comparisons depending on what they report on regularly.
Who uses finance dashboards?
- CFOs and finance managers use them for oversight and reporting. Accountants use them to track transactions and reconcile numbers. Business owners use them to monitor cash flow and profitability without waiting for month-end reports.
Can I build a finance dashboard without technical skills?
- Yes. Dashboard software like Zoho Analytics connects directly to your accounting tools and offers prebuilt templates you can use right away. You can also make use of its AI capabilities like Ask Zia to create dashboards using simple prompts and get insights with Zia Insights.
How do I connect my accounting software to Zoho Analytics?
- Go to the data sources section, select your tool, like Zoho Books, QuickBooks, Xero, Stripe, or others, and authorize the connection. Your data starts syncing automatically from there.
Can I combine data from multiple finance tools in one dashboard?
- Yes. Zoho Analytics lets you pull data from several sources. For example, connect Zoho Books for accounting and Stripe for payments and blend them into a single dashboard without any manual work. You can also blend non-financial apps like CRM and blend data for comprehensive analysis.
Can I schedule finance reports to be sent automatically?
- Yes. Zoho Analytics lets you set up automated email reports on a daily, weekly, or monthly schedule. Your CFO or board members receive the latest numbers in their inbox without anyone having to manually pull and send them.
Are the finance dashboard templates free to use?
- Yes. Prebuilt finance dashboard templates in Zoho Analytics are available across plans. You can connect your data, use a template as your starting point, and customize it without any additional cost.