Explore 50+ Sales Dashboard Examples & Templates
Browse real-world sales dashboard examples built for revenue teams. From pipeline tracking to rep performance, find a template that fits your data and get started in minutes.
Explore Examples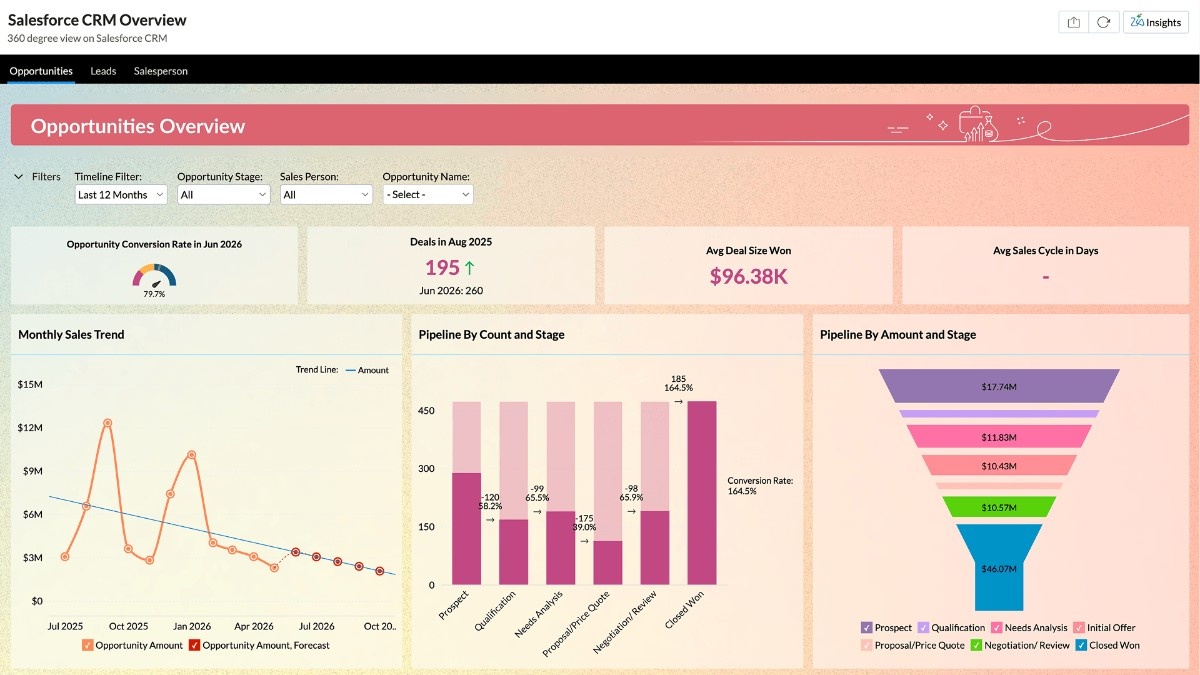
- 16K
Customers
- 3M
Users
Sales Dashboard Examples by Type
Explore ready-to-use sales dashboard examples for every use case, from pipeline tracking to sales rep performance. Each type includes multiple examples you can customize.
Sales Overview Dashboard
Track your complete sales performance at a glance. This dashboard gives sales managers a quick read on revenue, open deals, win rate, and quarter-over-quarter trends in one view.
- Total revenue
- Open deals
- Expected revenue
- Win %
- Won deals vs total deals
- QoQ sales comparison
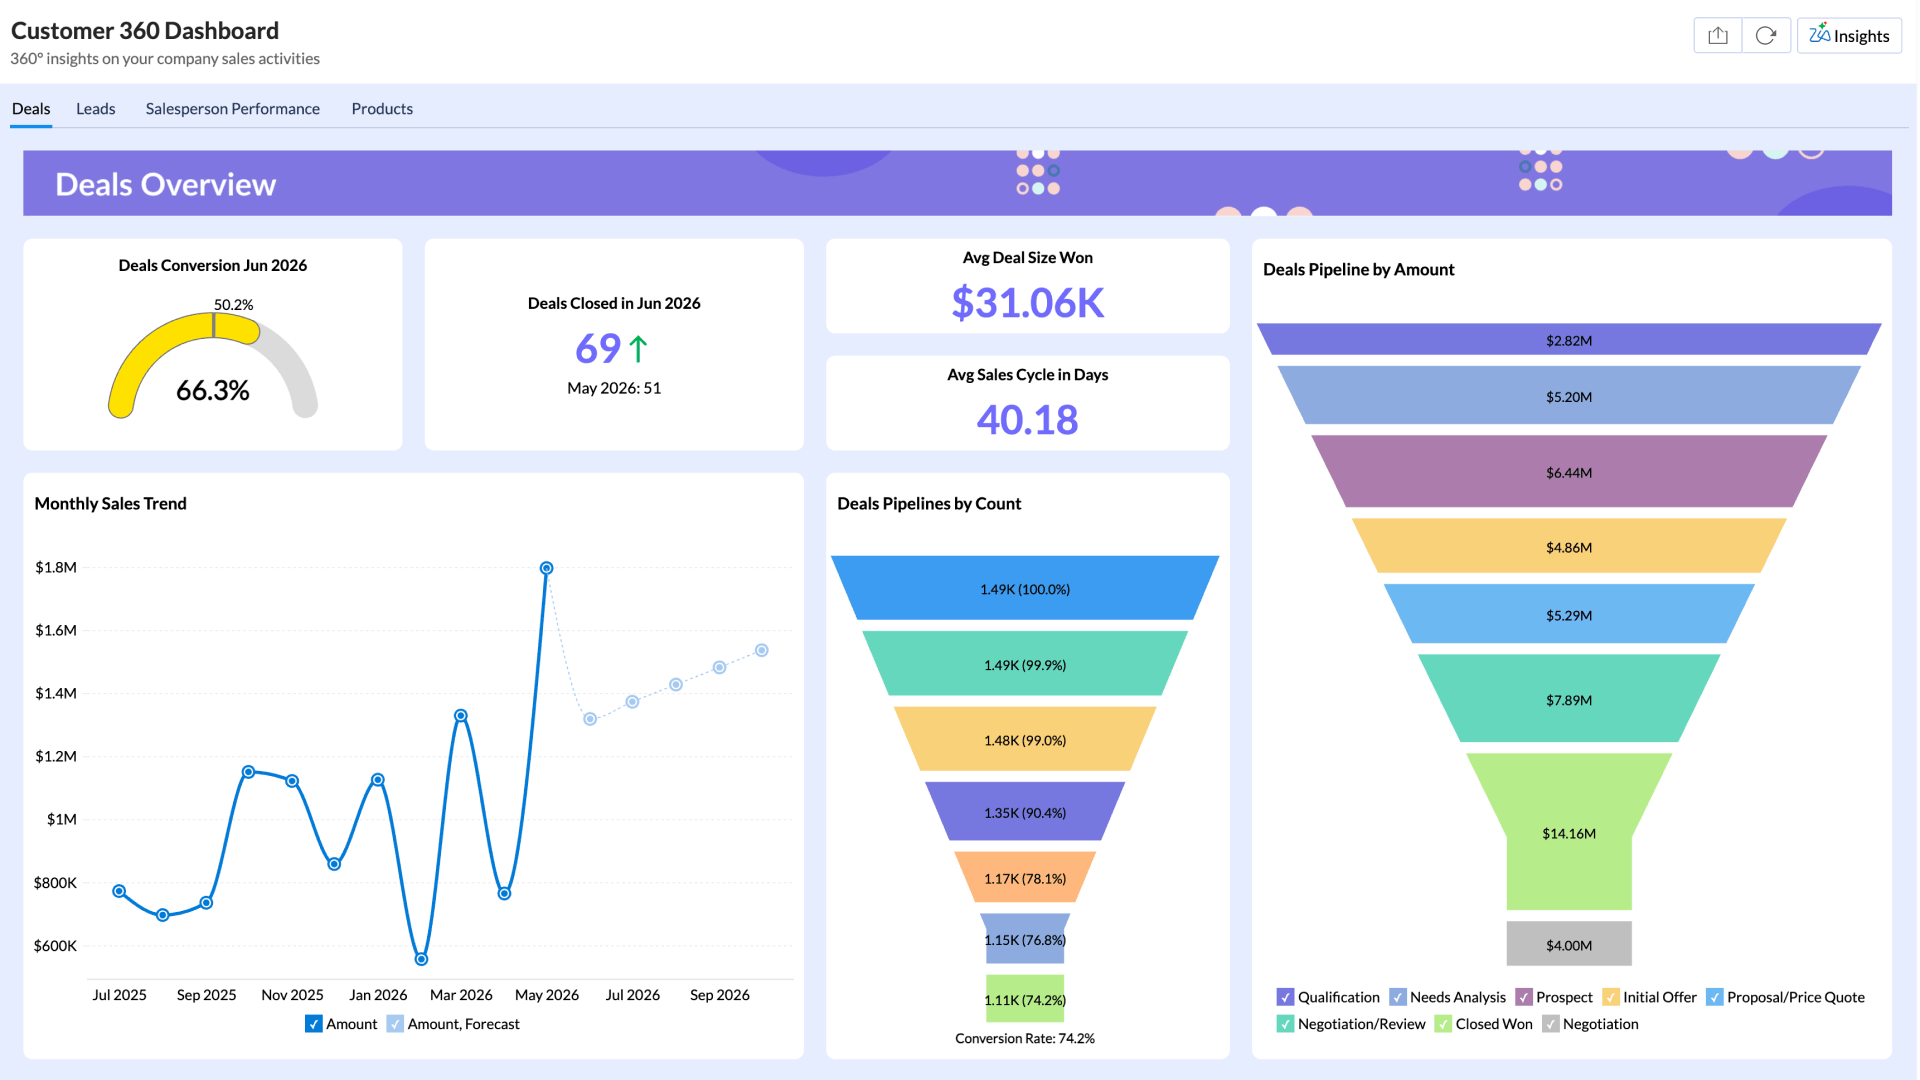
Sales Deals Dashboard
Monitor every deal across its lifecycle from pipeline entry to close. Spot conversion bottlenecks, track average deal size, and compare won vs lost deals by month.
- Won amount
- Won deals count
- Average deal size
- Average sales cycle (days)
- YTD sales
- Conversion rate
- Deals pipeline by stage
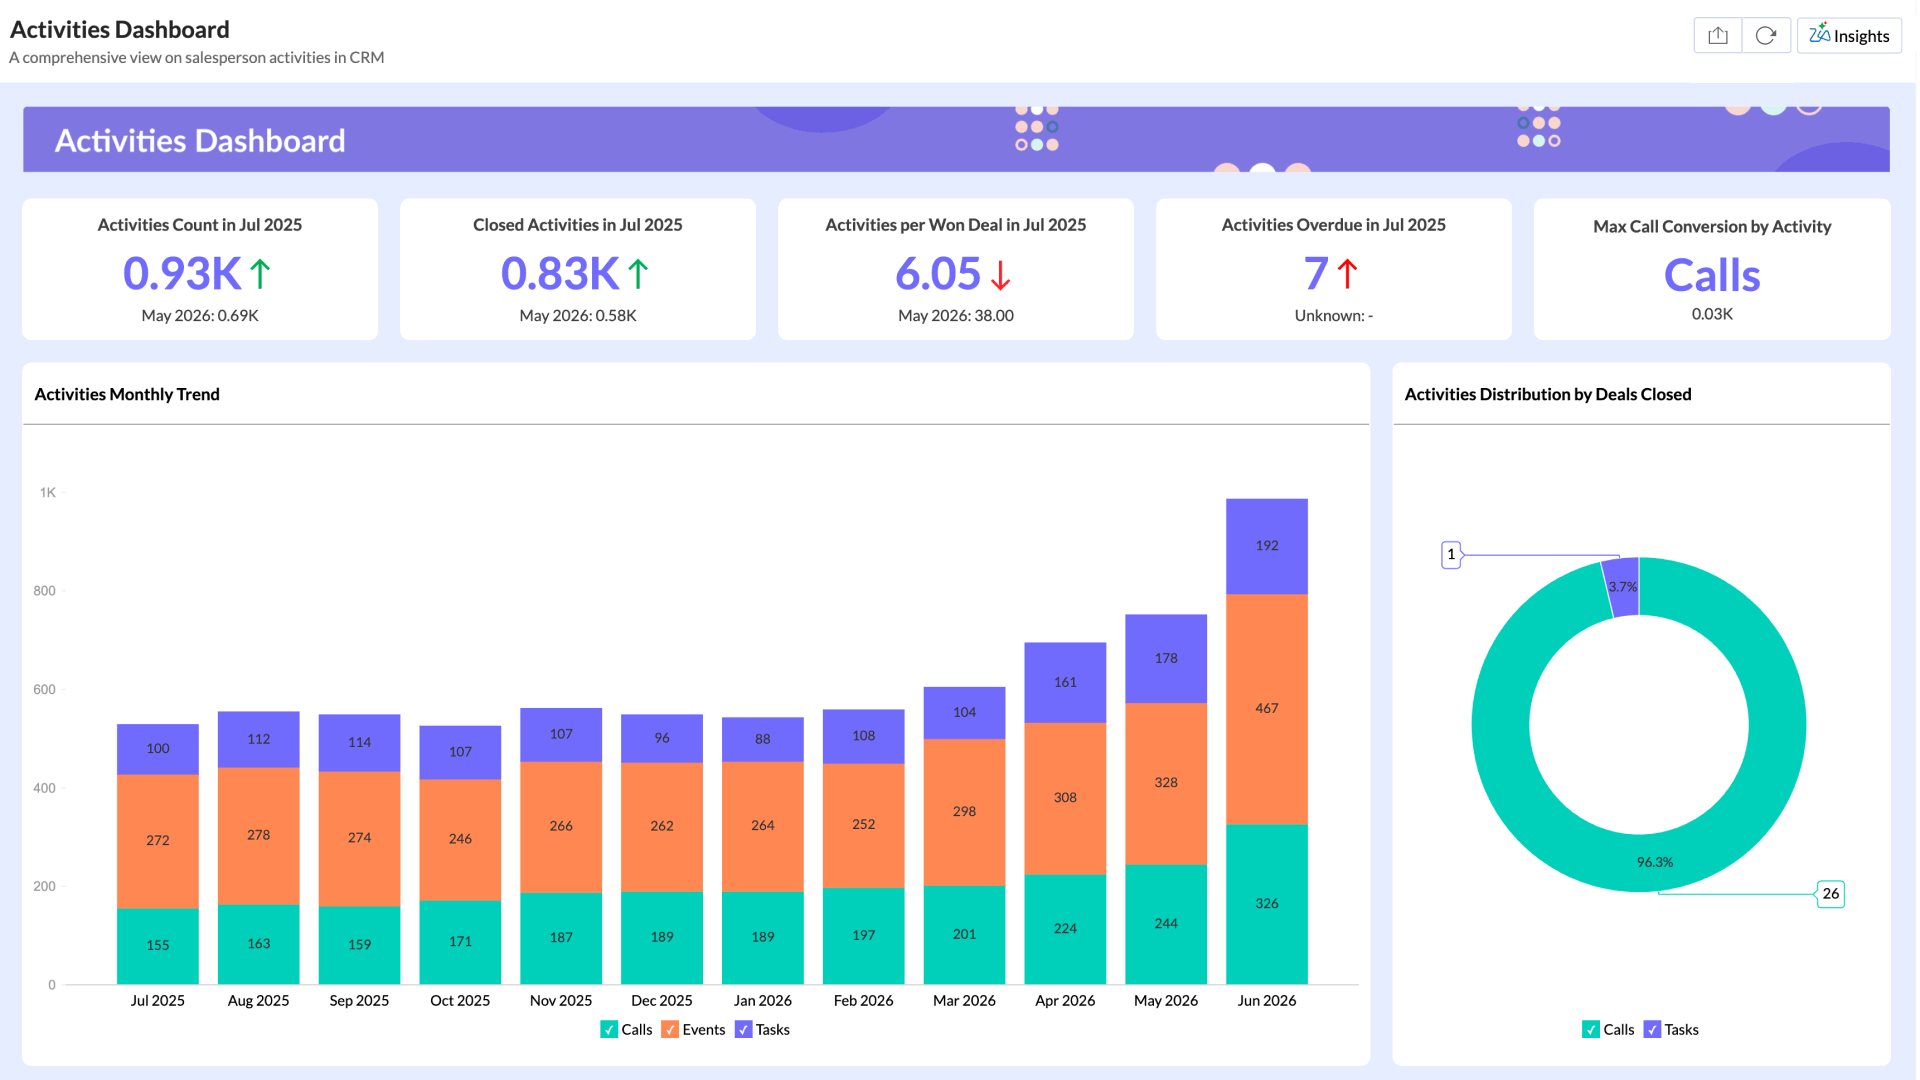
Sales Activities Dashboard
See how your team's daily activities, such as calls, tasks, and events, translate into closed deals. Identify which activity types drive the most conversions and flag reps with open deals sitting idle.
- Activities count
- Closed activities
- Activities per won deal
- Overdue activities
- Maximum call conversion by activity type
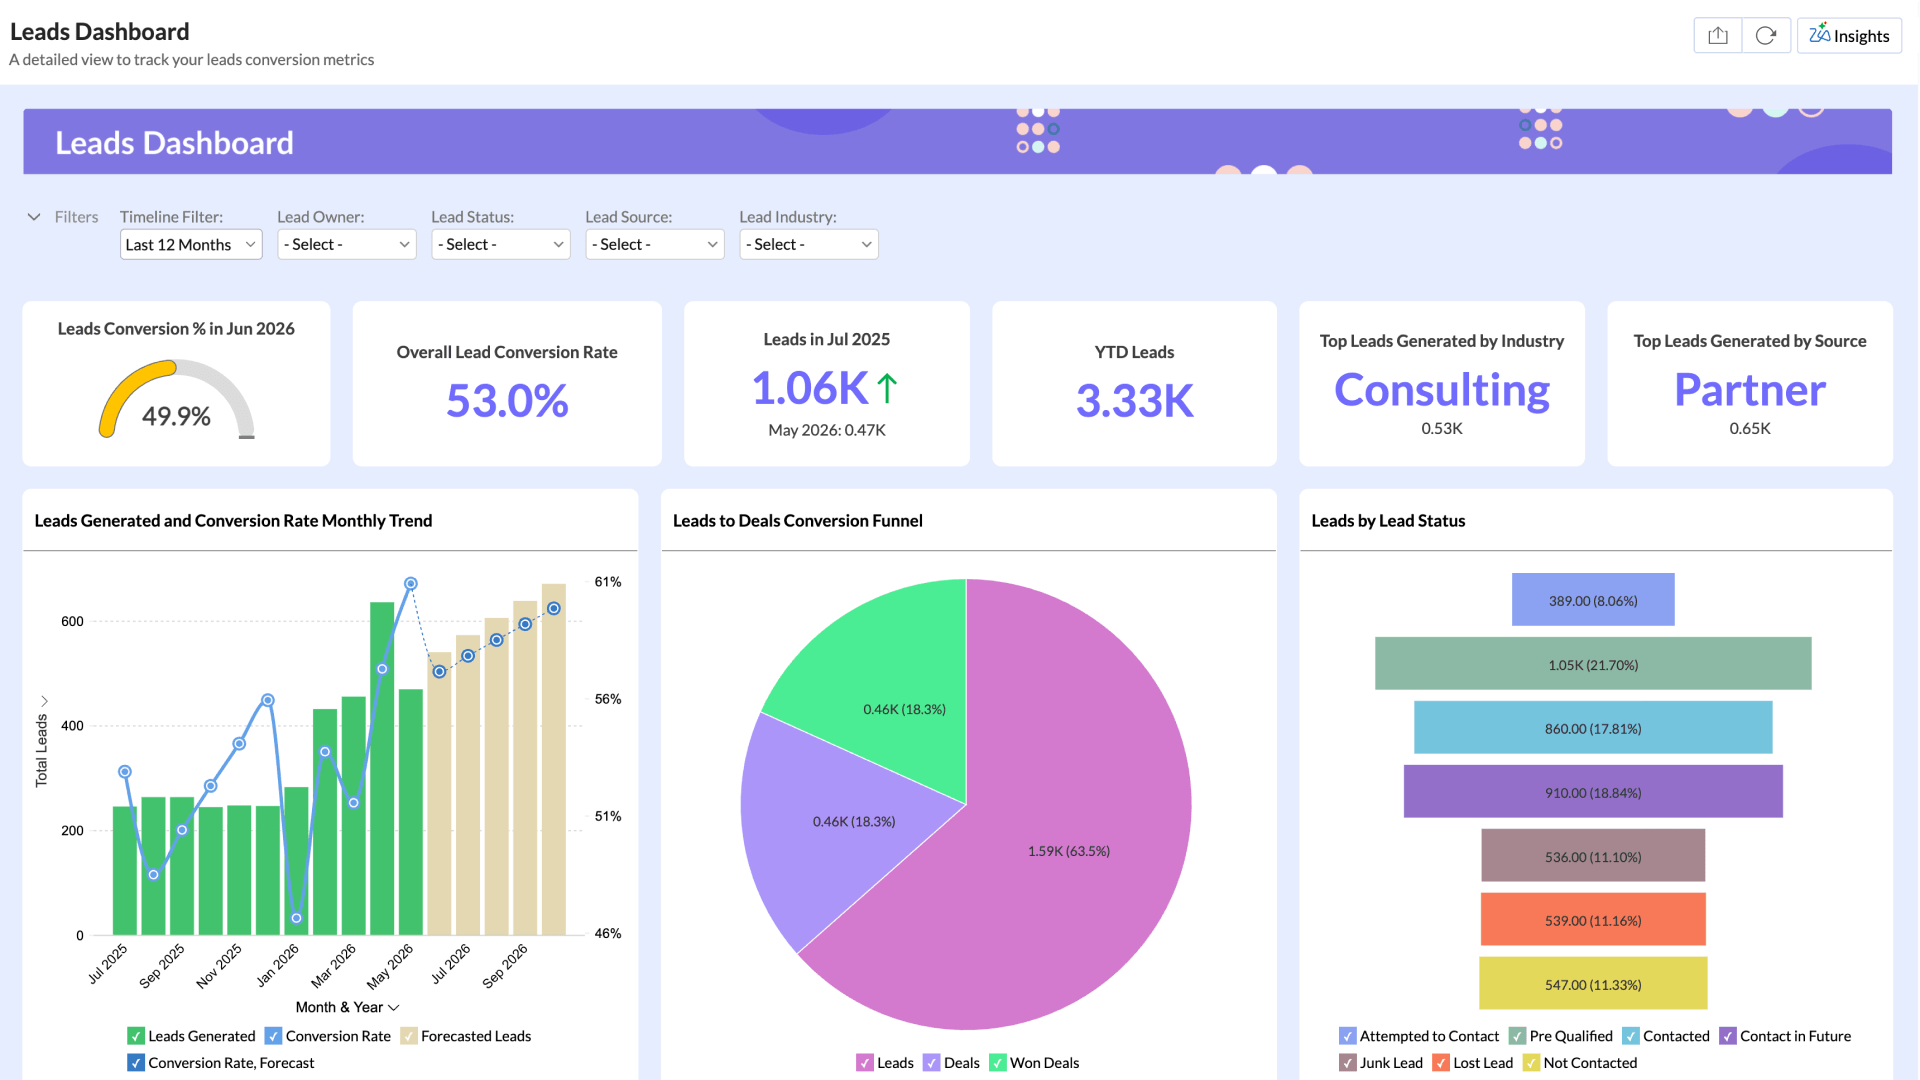
Sales Leads Dashboard
Understand where your leads come from, how fast they convert, and which industries and sources deliver the most pipeline. Track lead quality from first touch to closed deal.
- Lead conversion rate
- Total leads (YTD)
- Leads to deals funnel
- Top lead source
- Top lead industry
- Leads by status
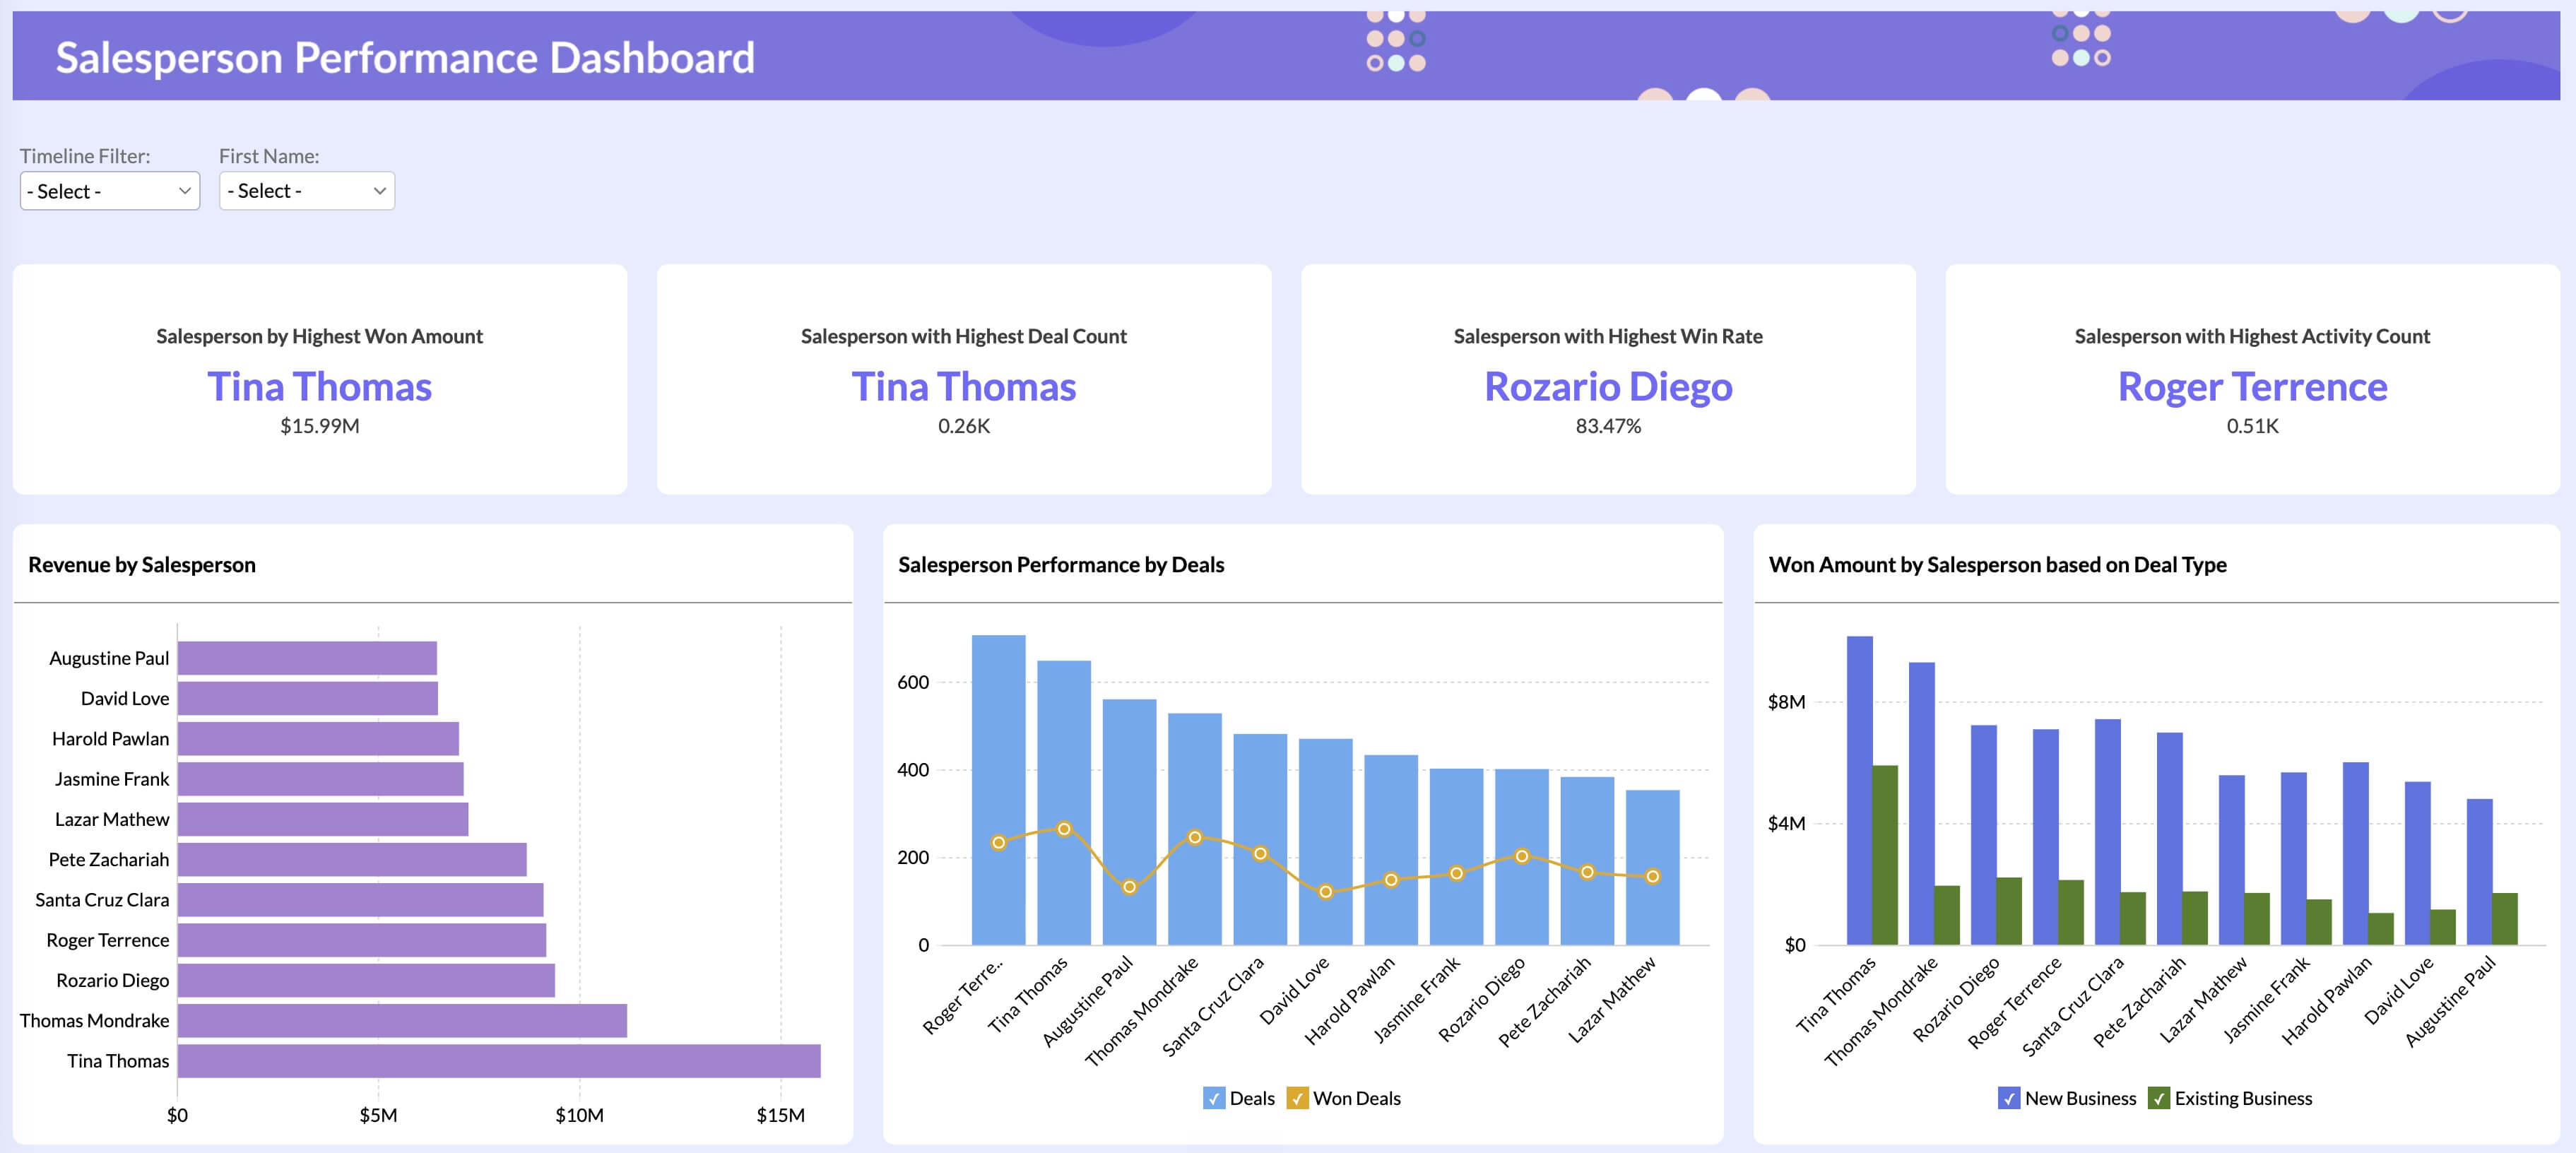
Salesperson Performance Dashboard
Compare rep performance across revenue, deal count, win rate, and activity volume. Quickly identify your top closers and spot reps who need coaching.
- Revenue by salesperson
- Deals won
- Win rate per rep
- Activity count
- Won amount by lead source
- New vs existing business
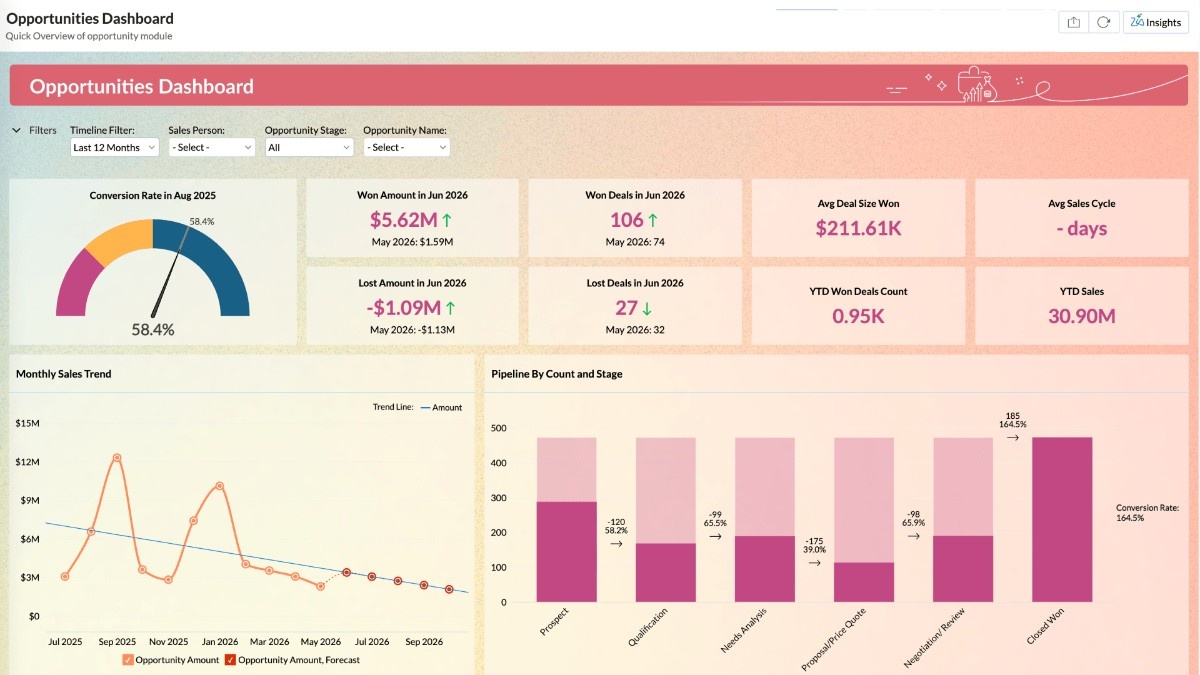
Sales Opportunities Dashboard
Get a clear picture of your opportunity pipeline by stage, conversion rate, and deal value. Track how opportunities progress month over month and where deals are stalling.
- Won amount
- Lost amount
- Won deals count
- Average deal size
- YTD sales
- Pipeline by count and stage
- Monthly sales trend
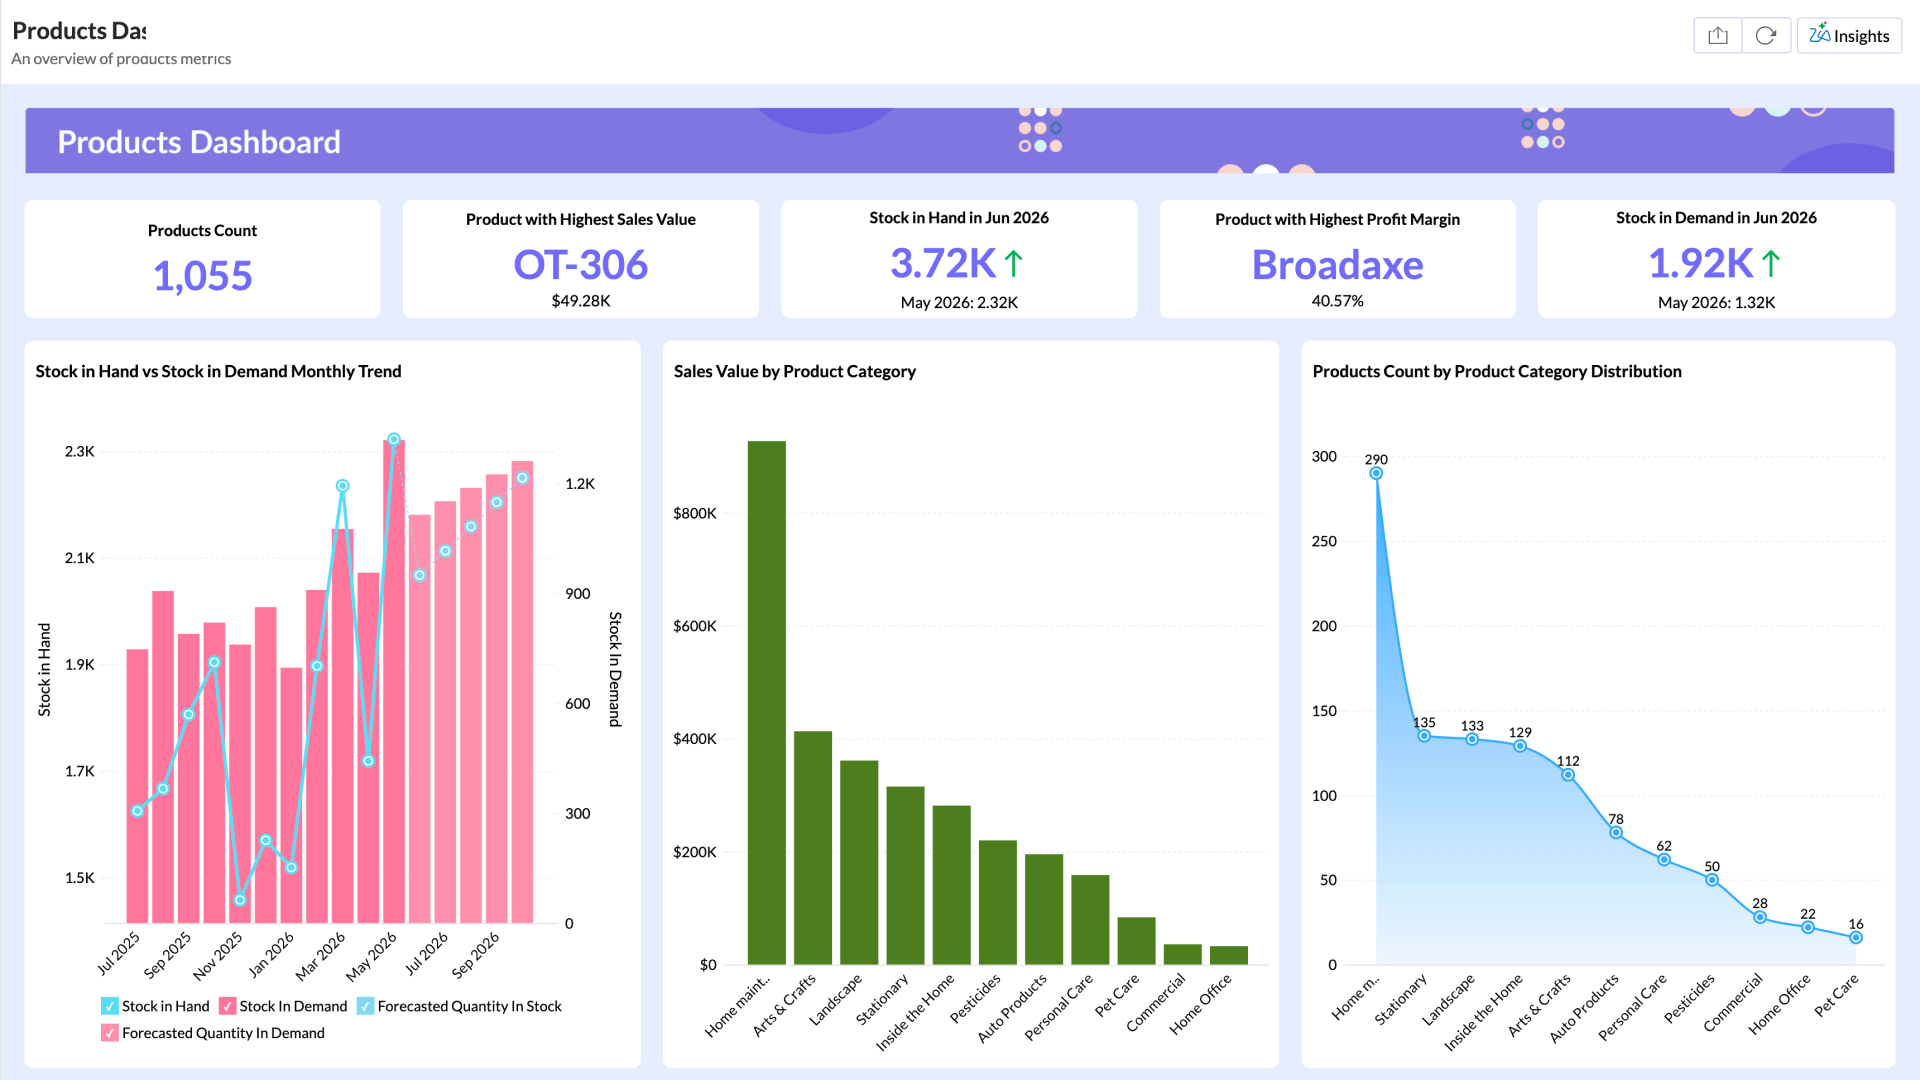
Sales Products Dashboard
Analyze which products drive the most revenue, which ones have the highest attach rate, and how product sales trend over time. Useful for quota planning and inventory decisions.
- Revenue by product
- Top-selling products
- Product win rate
- Sales volume by period
- Product mix by deal type
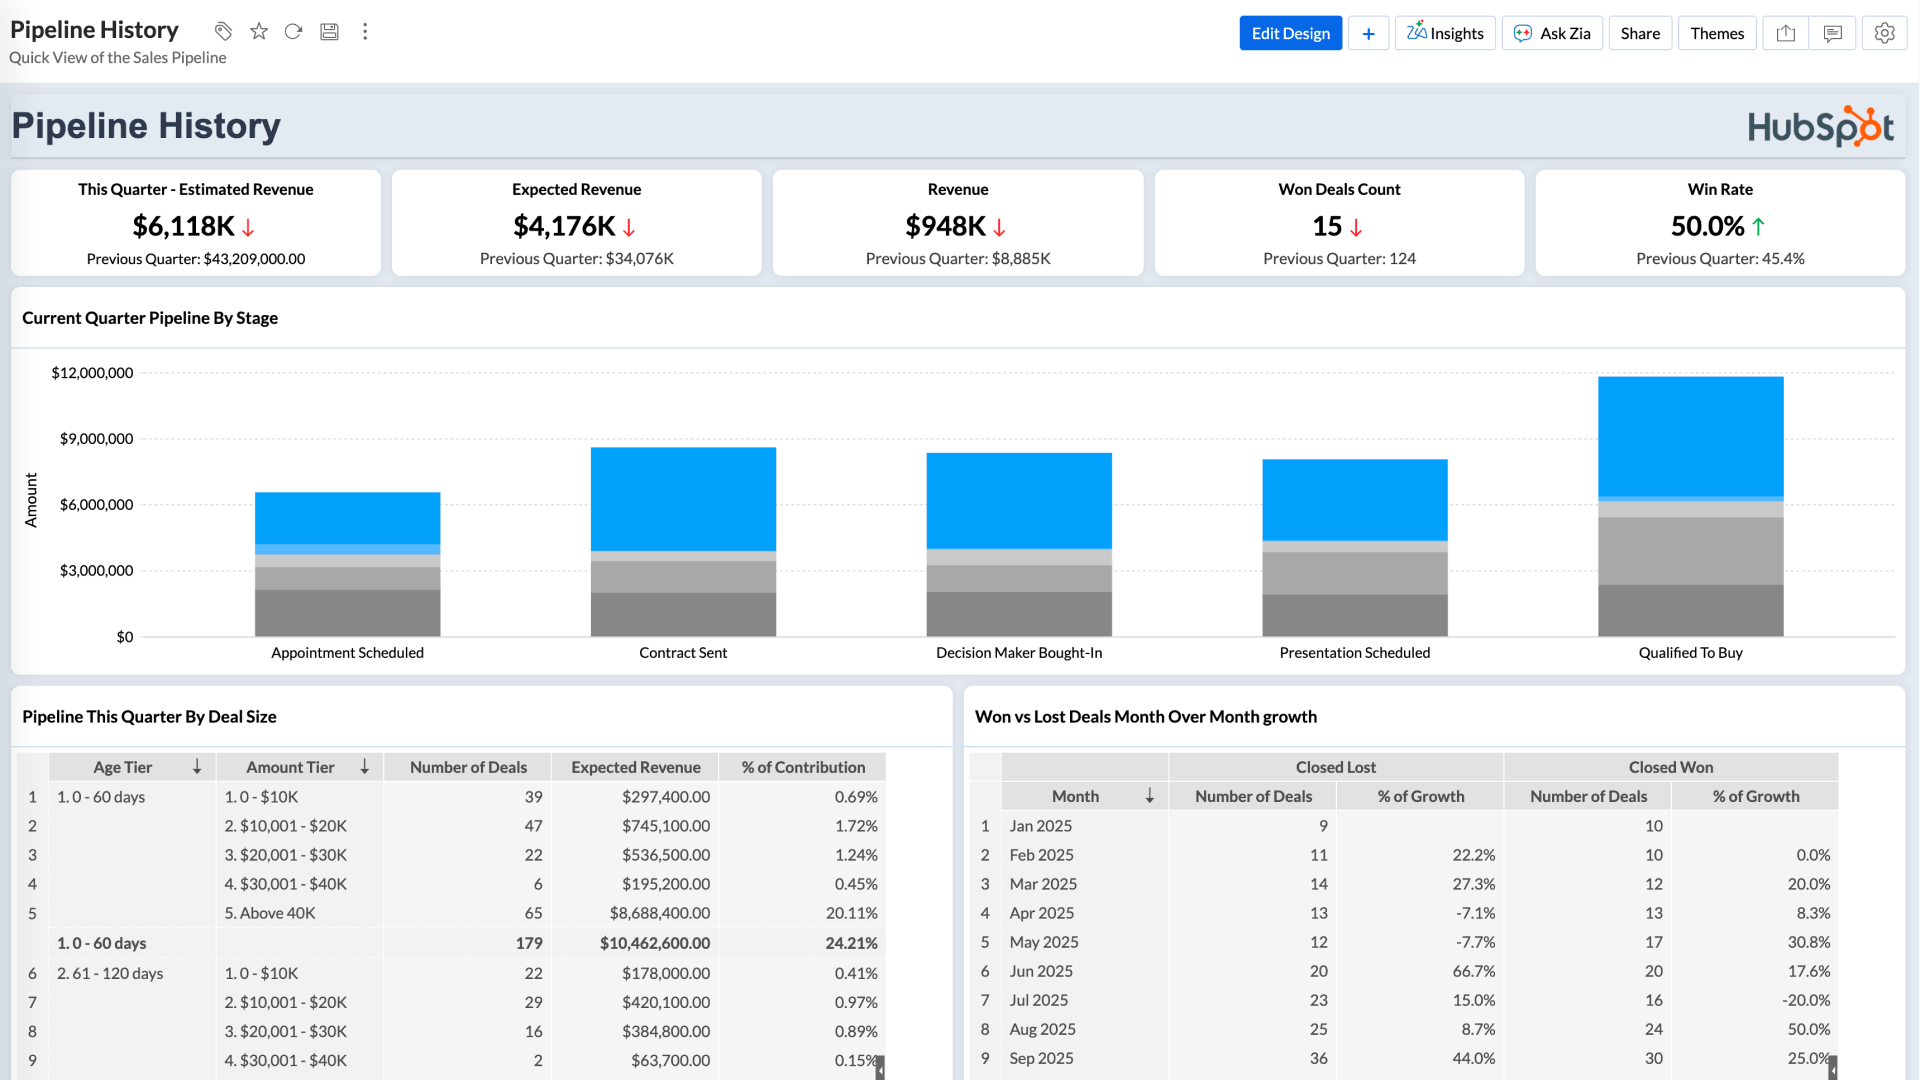
Sales Pipeline Dashboard
Get a historical and current view of your pipeline health. Track estimated revenue, expected close dates, and deal aging, broken down by stage and quarter.
- Estimated revenue (this quarter)
- Expected revenue
- Won deals count
- Win rate
- Pipeline by stage
- Deal aging buckets
Connect popular CRMs you already use
Zoho Analytics is sales dashboard software that integrates with the platforms your sales team relies on every day. Get these sales dashboards generated prebuilt for you as soon as you connect your CRM.
Zoho CRM
Pull your Zoho CRM data into Zoho Analytics and build sales dashboards without any manual exports. The integration syncs automatically.
Salesforce CRM
Connect Salesforce to Zoho Analytics and get deeper reporting than native Salesforce dashboards allow, across deals, reps, and pipeline stages.

Microsoft Dynamics CRM
Bring your Microsoft Dynamics CRM data into Zoho Analytics to analyze sales performance, forecast revenue, and track team activity in one place.

HubSpot CRM
Sync HubSpot deals, contacts, and pipeline data with Zoho Analytics to build custom sales reports your HubSpot reports can't show.
Zoho Bigin
Connect Zoho Bigin to Zoho Analytics and turn your small business pipeline data into clear, visual sales dashboards.

Pipedrive CRM
Import Pipedrive data into Zoho Analytics to track deal progress, rep performance, and revenue trends with more flexibility.
How to create sales dashboards using Zoho Analytics
Connect your data once. Your sales dashboards stay updated automatically.
Connect your CRM and sales tools
Link Zoho CRM, Salesforce, HubSpot, Pipedrive, or any other sales tool you use. Data syncs automatically, so your dashboards always reflect current numbers.
Access prebuilt sales dashboards
Get instant access to ready-made dashboards for deals, pipeline, rep performance, leads, and more. Just connect your data and the dashboards populate on their own.
Build custom dashboards your way
Drag and drop charts, KPI widgets, and tables to create dashboards that match exactly what your team tracks. Filter by rep, region, time period, or deal stage without writing a single query.
Share dashboards with your team securely
Share live, interactive dashboards with sales managers, executives, or external stakeholders. Control who can view, edit, or export, so the right people see the right data.
Hear from our customers

Simone Drera
VP-Business Development, Flexxaire Inc."We wanted a simple BI solution to analyze our sales, project, and quality data. The tool also needed to be capable of integrating multiple tables, creating models to create charts that could be shared seamlessly across teams."

Moises Ochoa
Application Engineer, Cementos Progreso"With Zoho Analytics, the time spent in creating charts, reports and dashboards went down by 50%. More importantly, our software expenses were reduced by 30%!"

Marc Andrew
Senior Developer, Rental Car Manager"Our main alternate would have been Power BI, but we quickly found that the pricing and user-friendliness wouldn't quite work for a lot of our customers."
Frequently asked questions
What is a sales dashboard?
- A sales dashboard is a visual report that pulls your CRM and sales data into one screen. It tracks metrics like revenue, pipeline, deal stages, and rep performance in real time, so you don't have to dig through spreadsheets to know where things stand.
What should a sales dashboard include?
- At minimum: total revenue, open pipeline, deals won and lost, conversion rate, and average deal size. Many sales teams also add rep performance, lead source breakdown, and sales cycle length depending on what they're managing.
Can I build a sales dashboard without knowing SQL or coding?
- Yes. Dashboard software like Zoho Analytics lets you connect your CRM and build dashboards using drag-and-drop and Ask Zia, the AI agent. You don't need to write any queries or formulas to get started.
Can I share my sales dashboard with people outside my team?
- Yes. You can share dashboards with specific users via email, embed them in internal portals, or generate a public link with view-only access. You control permissions for each share.
Can multiple salespeople use the same dashboard with filtered views?
- Yes. You can set up user filters so each rep only sees their own deals and metrics when they log in, while managers see the full team view on the same dashboard.