- 16K
Customers
- 3M
Users
What you can achieve
Give every story the context and insights it needs
Pick the perfect visualization, every time
Turn organized visuals into stories that drive action
Build data stories in minutes, with no complex tools

Tell clearer stories with your data
Build data stories in a point and click interface
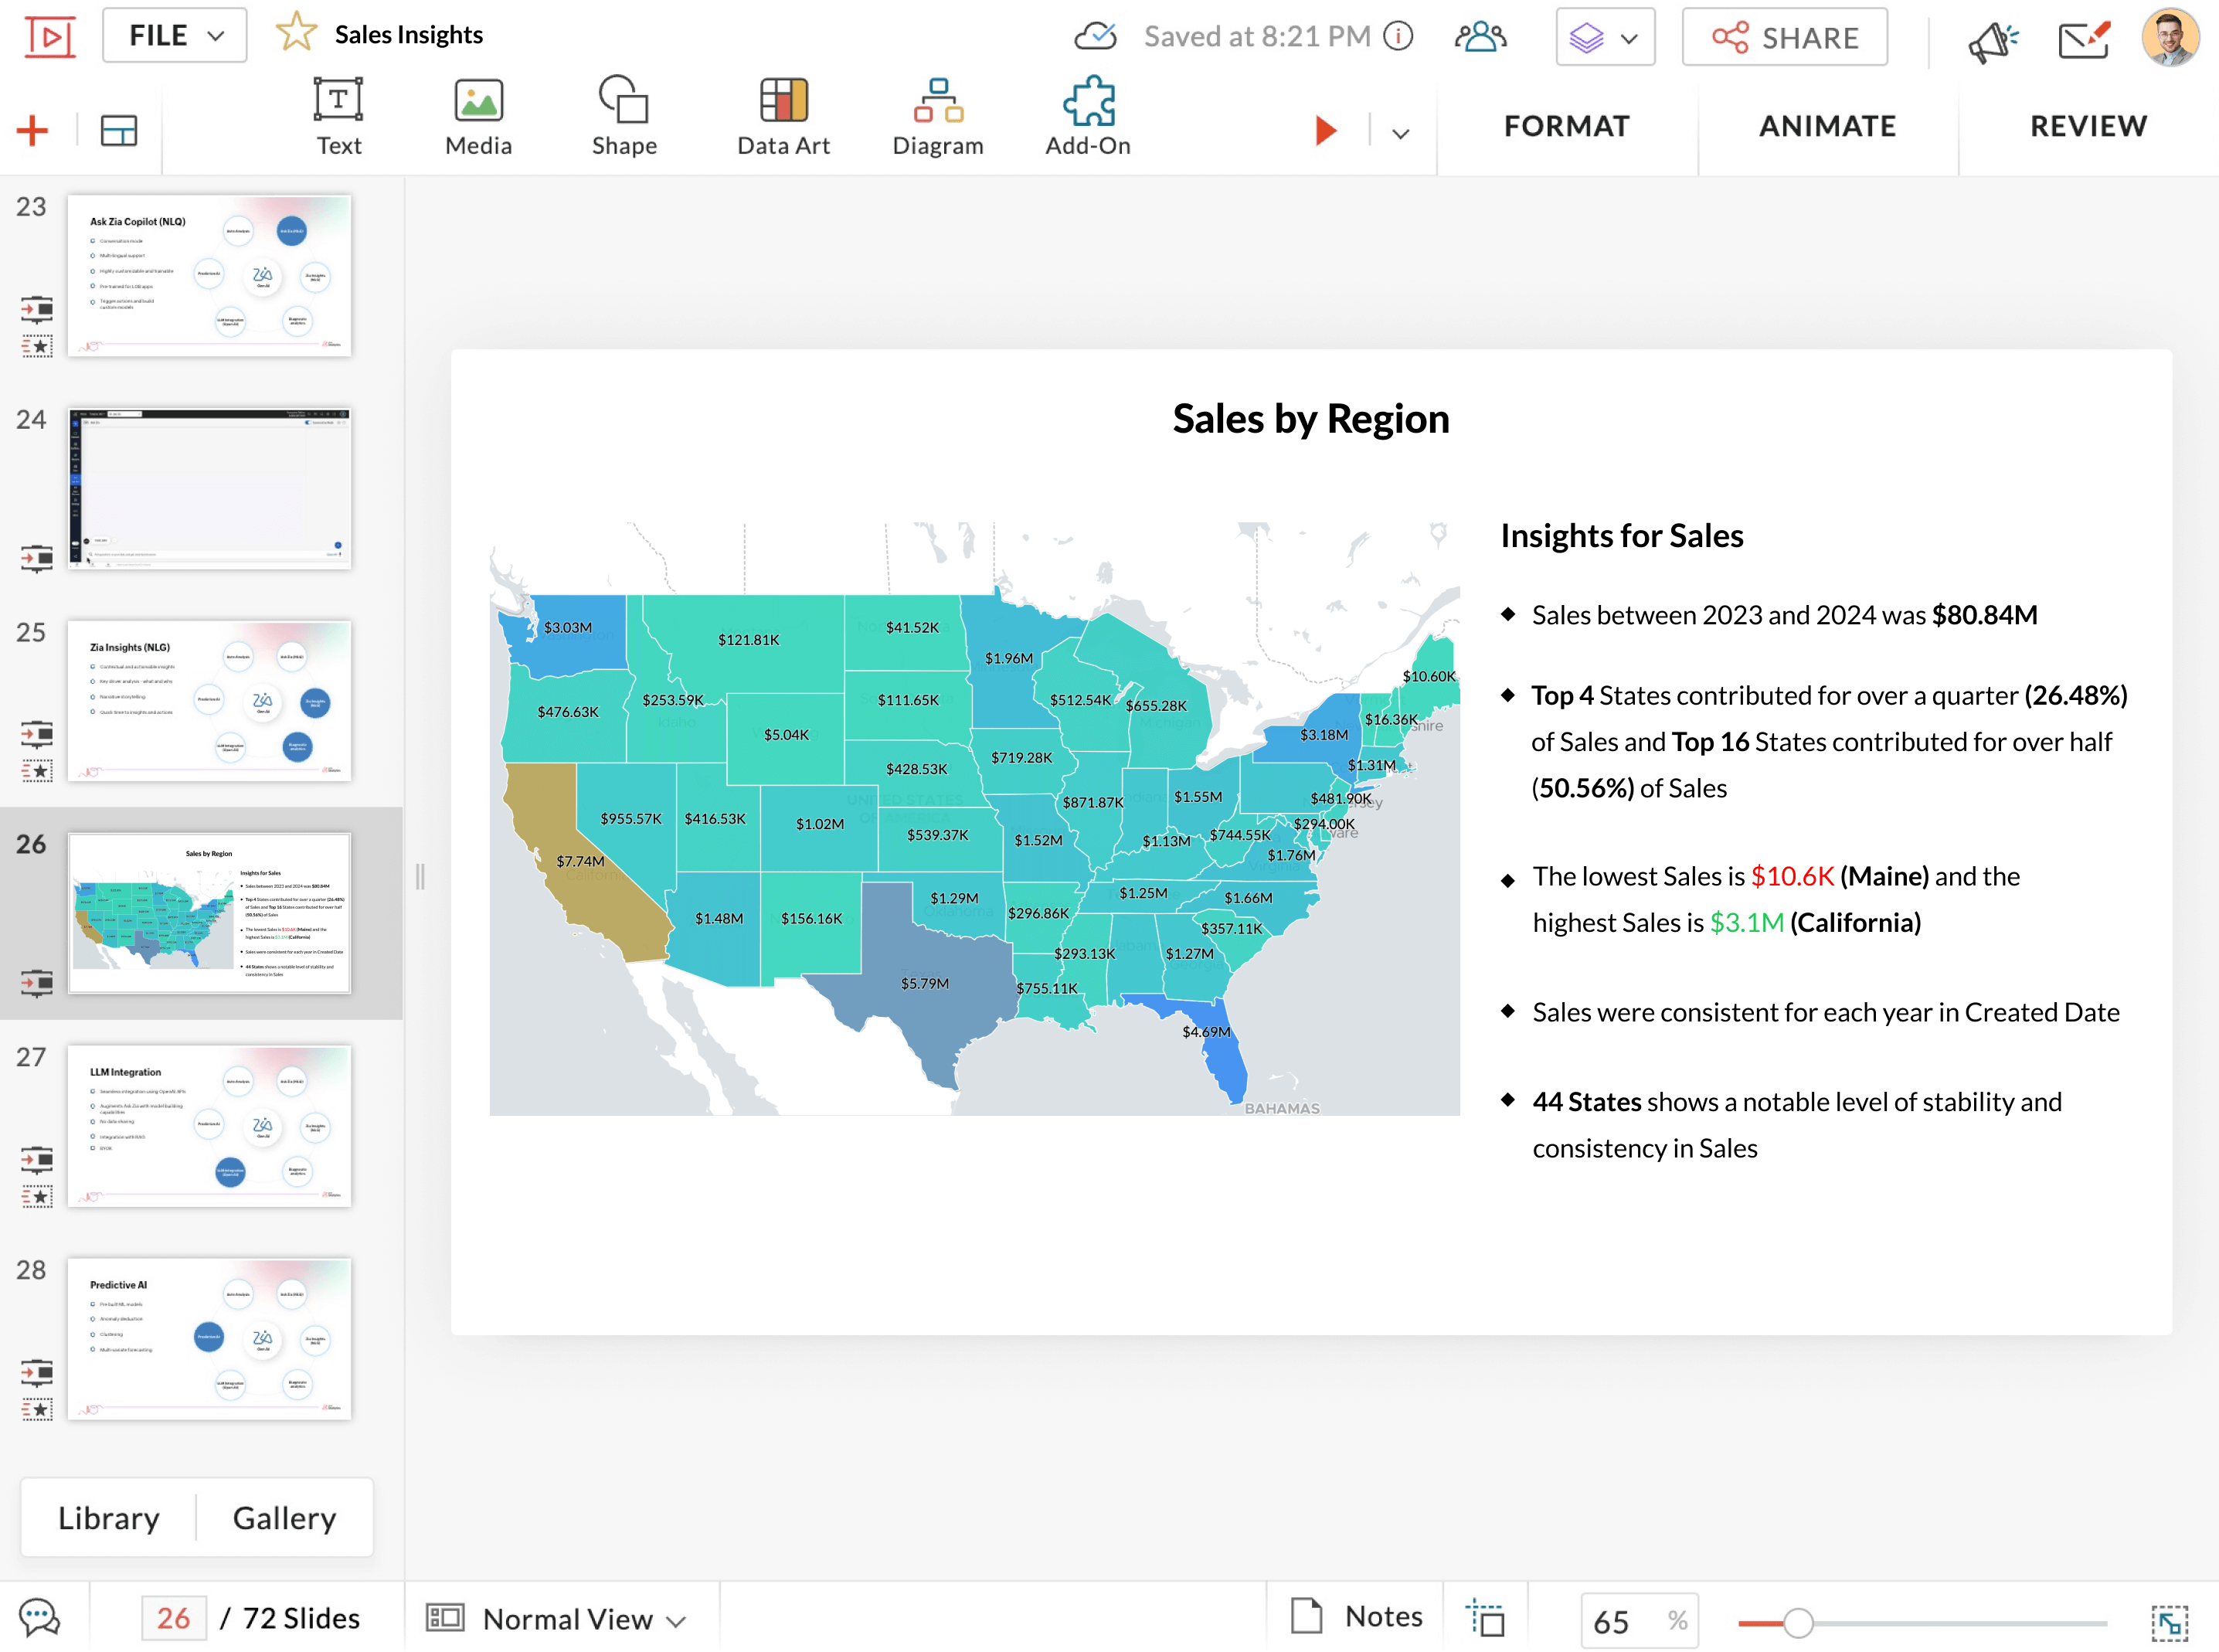
Create presentations and share them in a few clicks with the slideshow capability in Zoho Analytics. Advanced Slideshow, powered by Zoho Show, lets you build a full-fledged presentation with live visualizations and auto-generated narratives.
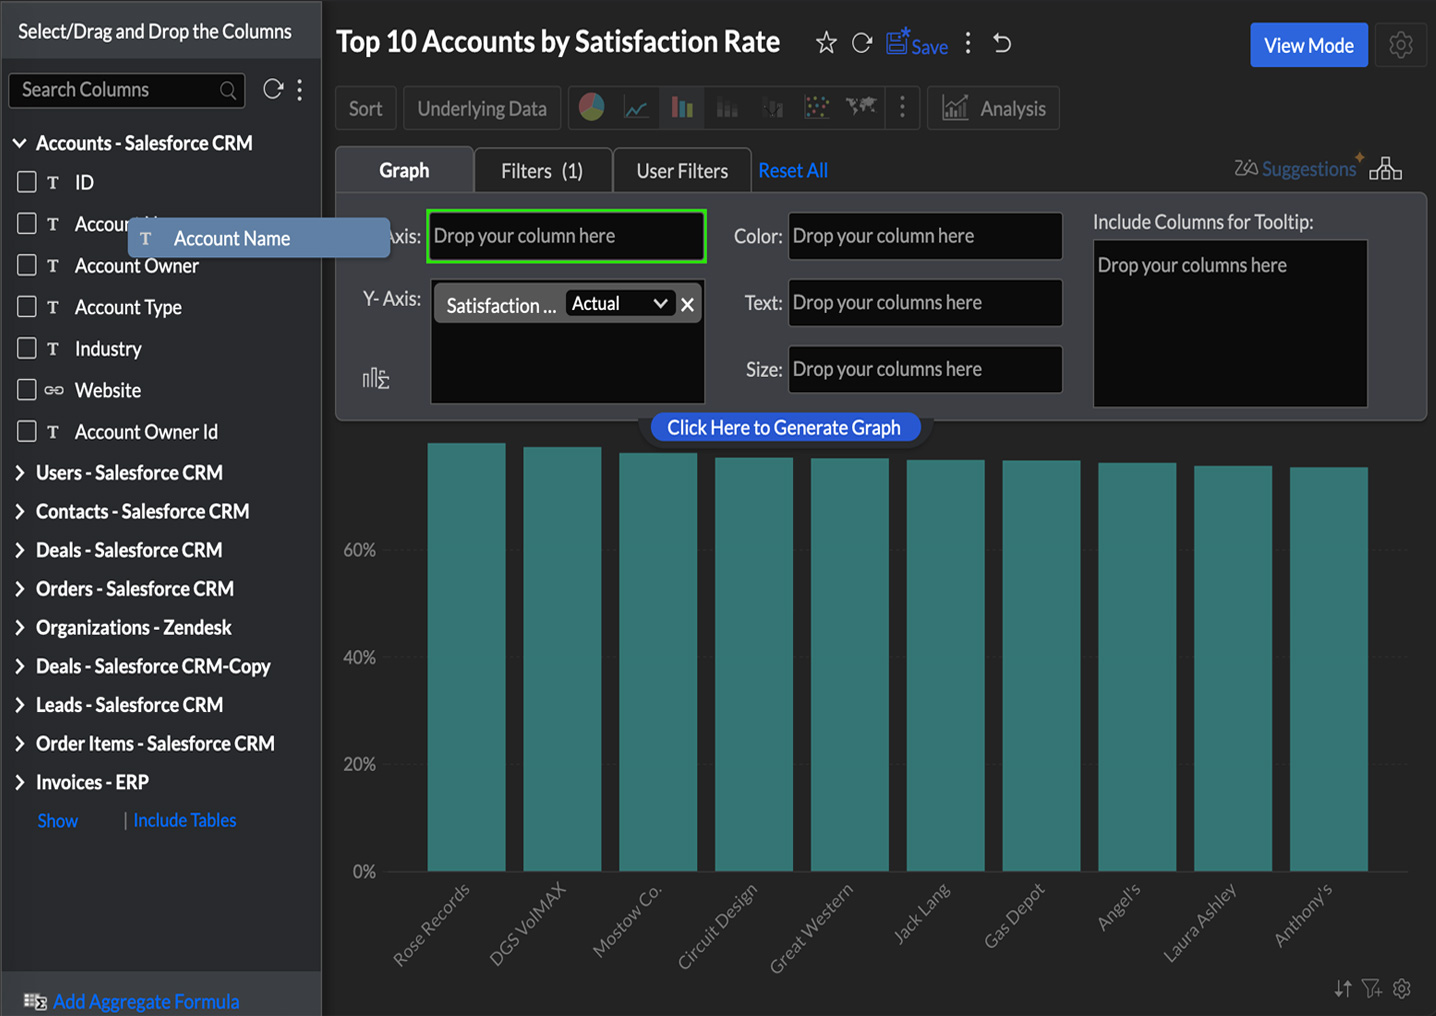
Put key metrics on display
Publish selected reports and dashboards as a basic slideshow for quick sharing or big-screen viewing. Autoplay your views on TVs and shared displays so important metrics stay visible without a presenter.
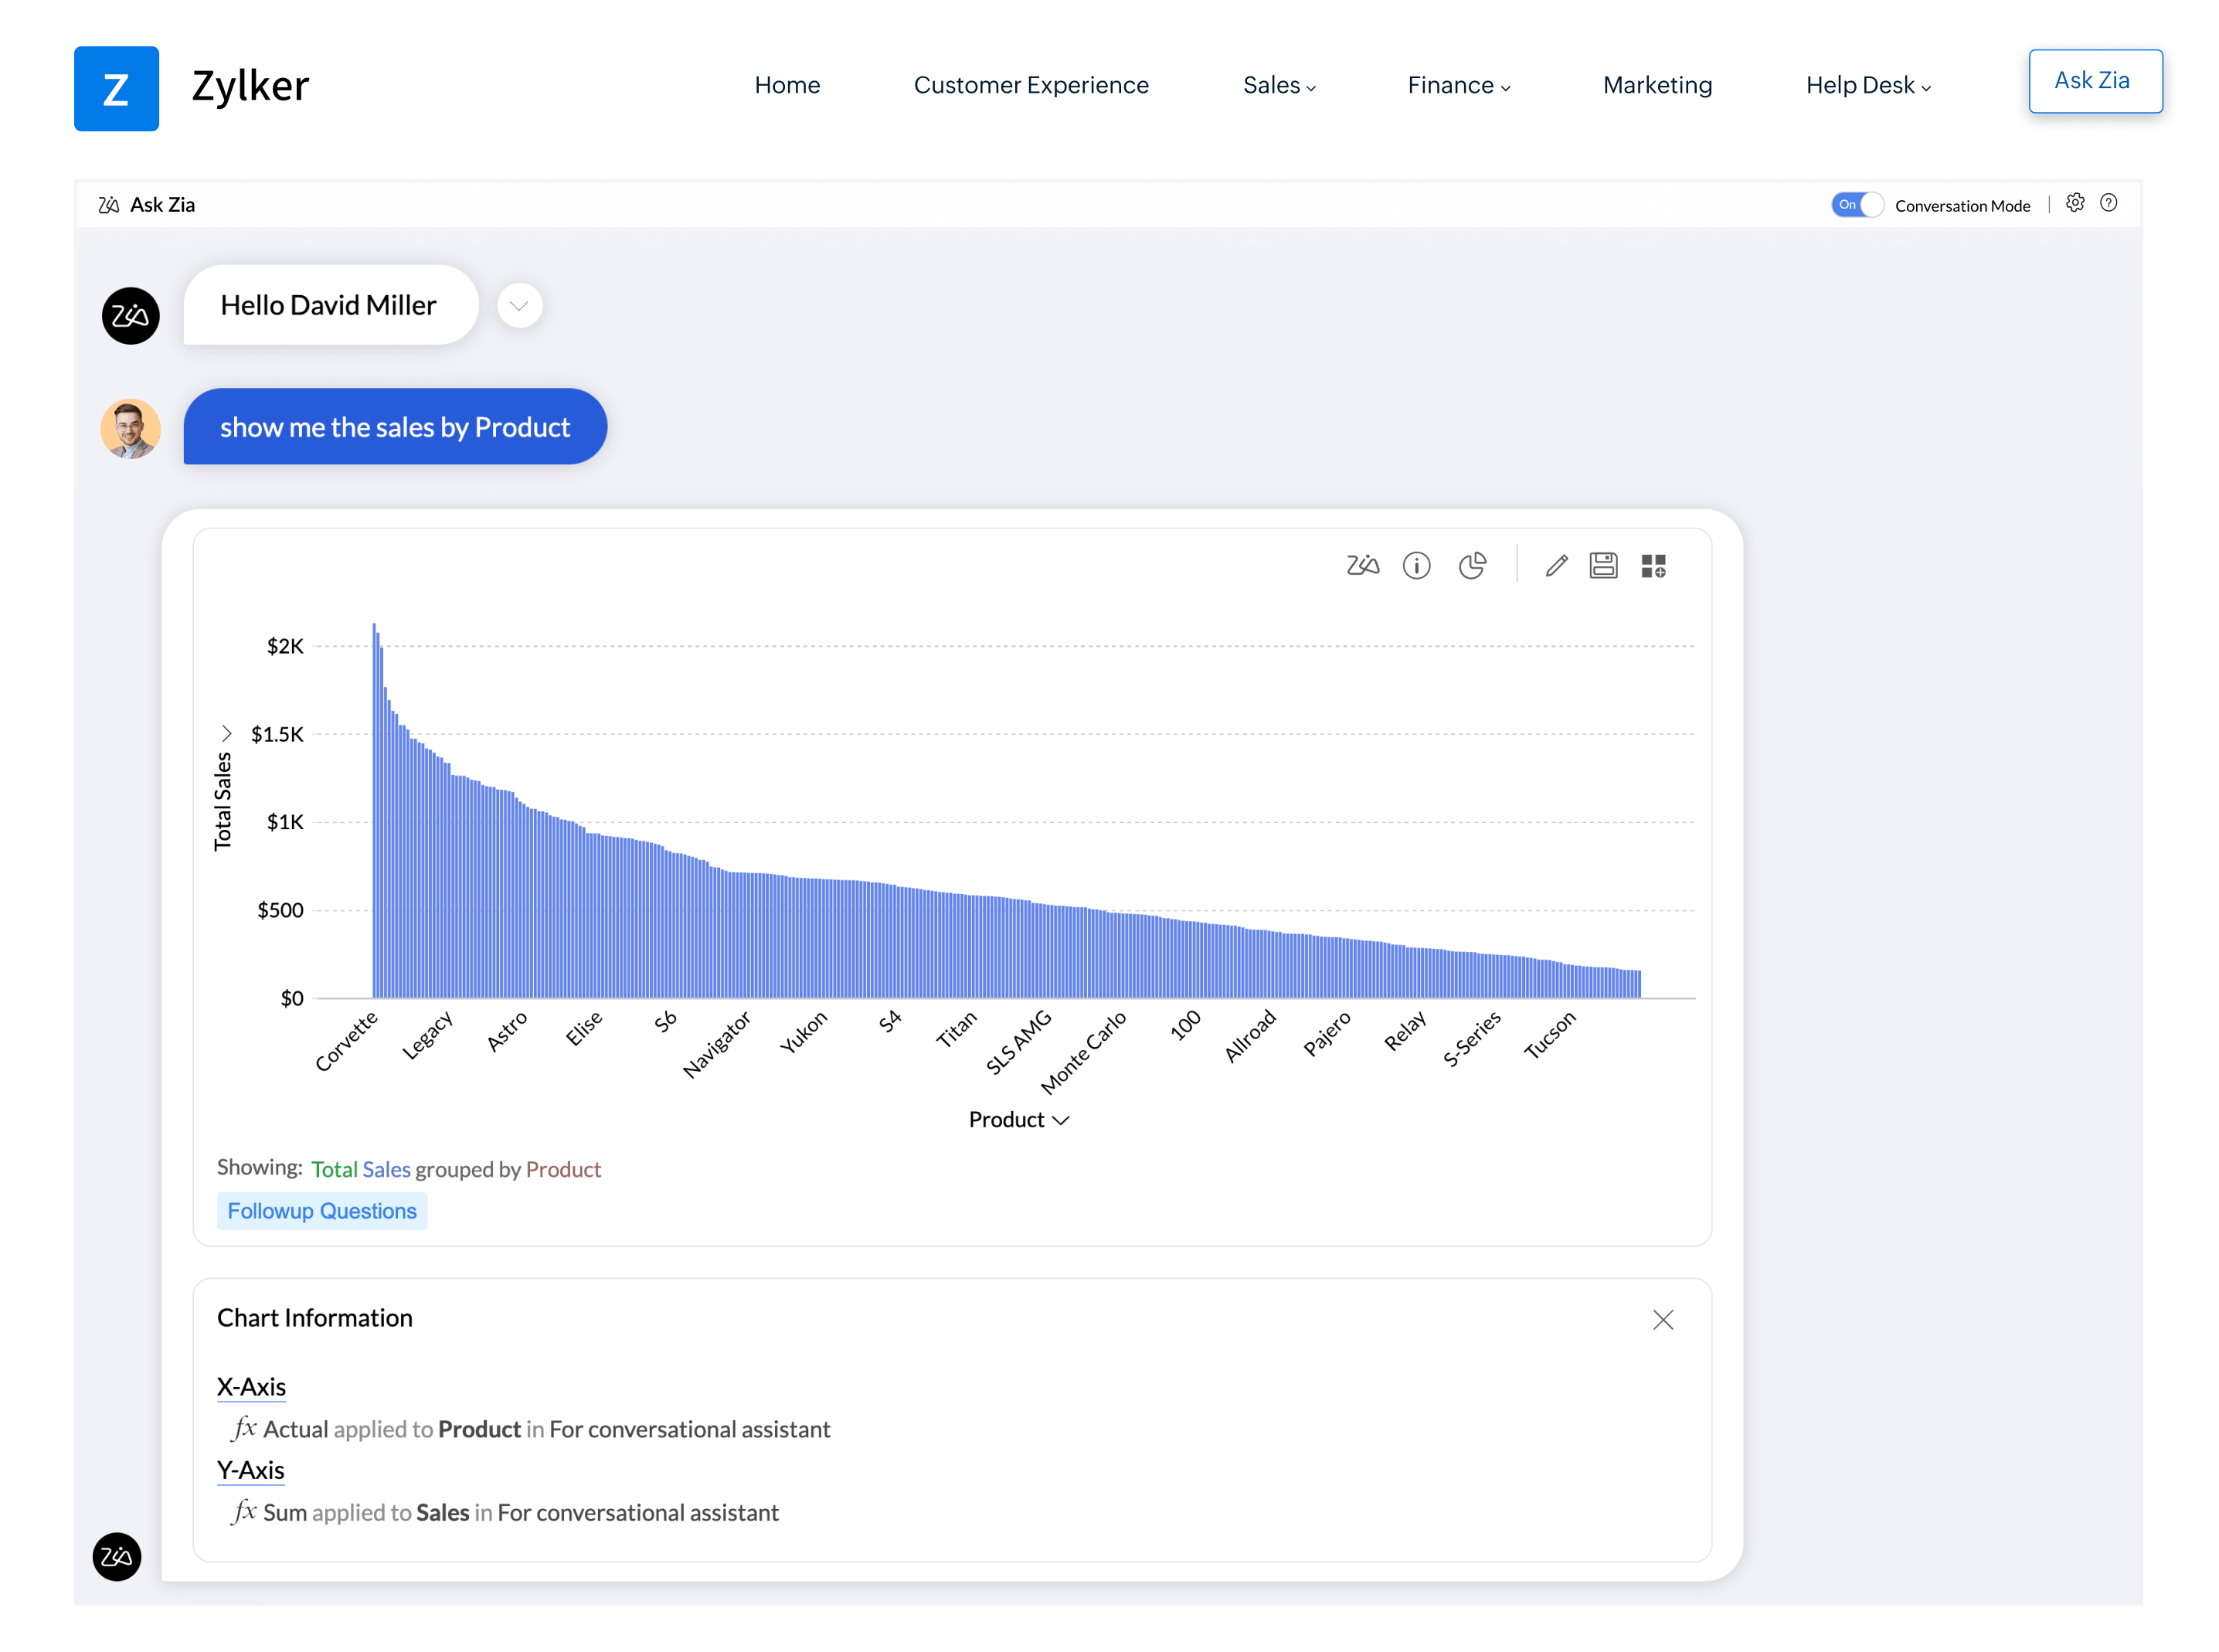
Ask and generate data stories
Let your audience, customers, and board members consume data as stories. Embed Ask Zia and Zia Insights in your business workflows so people can ask questions in natural language and get answers as charts blended with narratives.
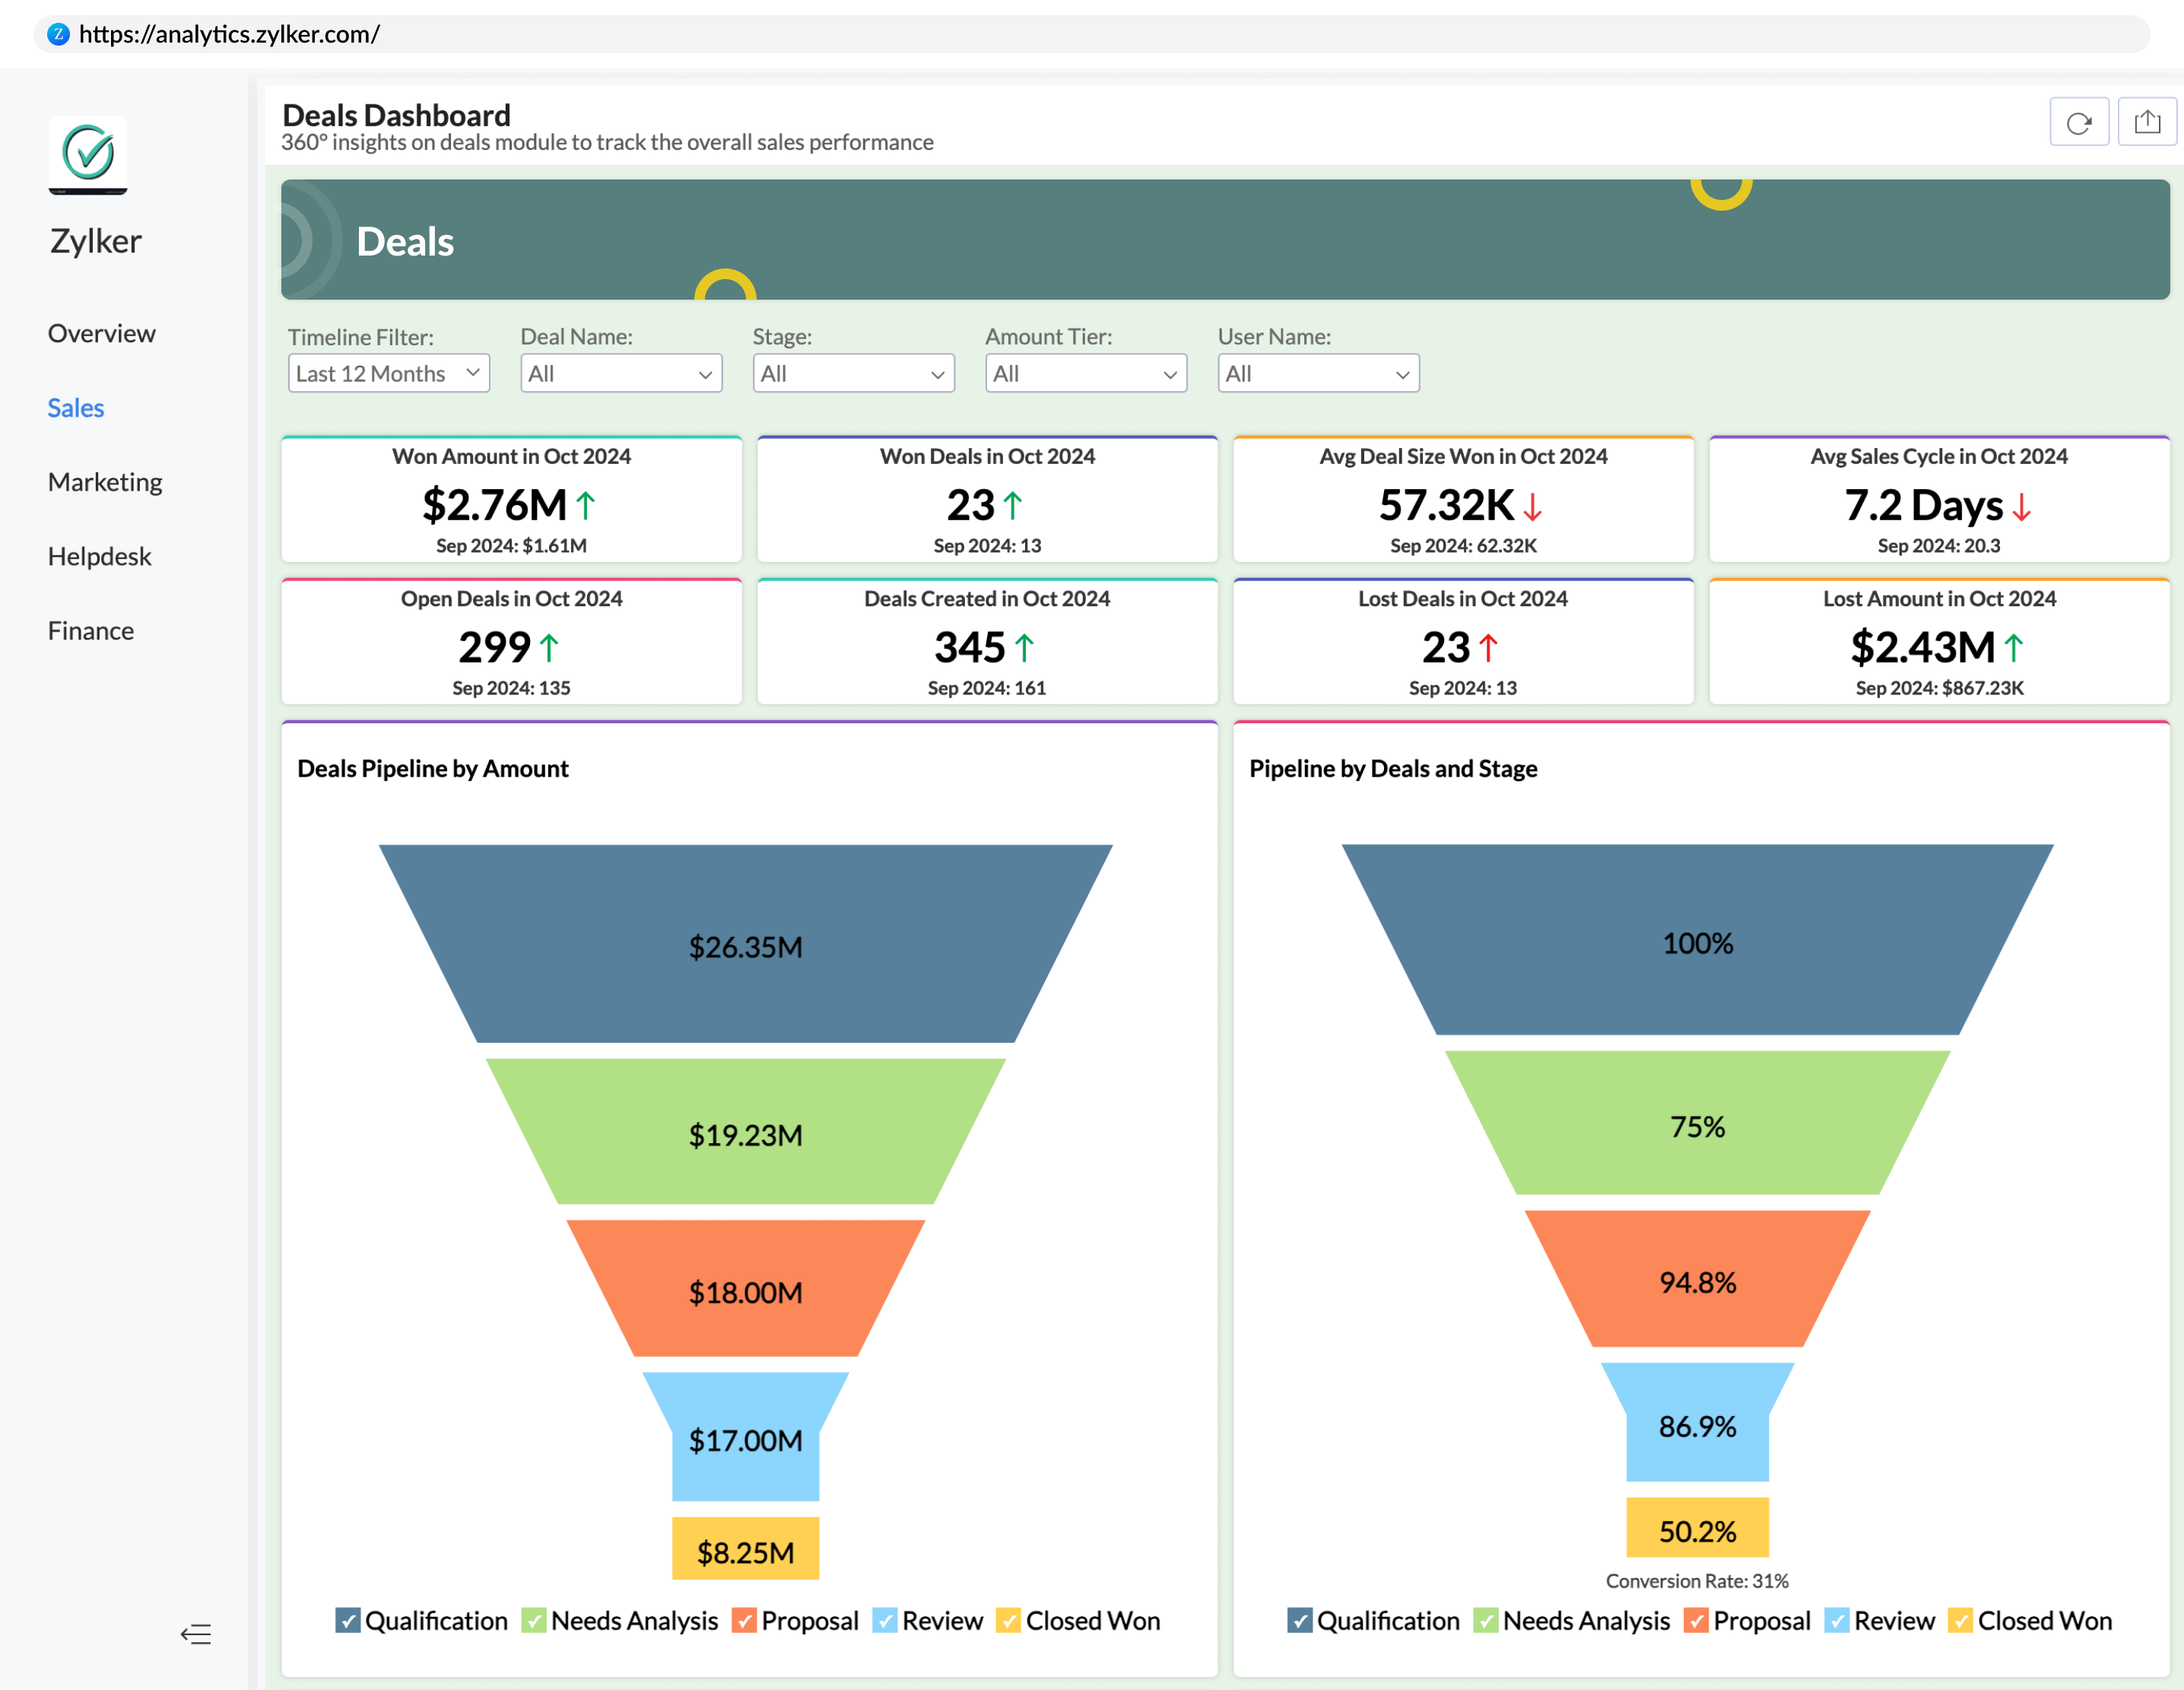
Democratize your data stories
Publish reports and dashboards using our intuitive site builder, Web Portals. It gives your organization and your customers an easy way to access analytics in real time and make informed decisions.
Hear from our happy customers
See all testimonials
ED Levis
Head of IT, NYC Navigator"Data visualization is important for any BI tool. It's great to present data in a way that is meaningful to the audience, helping them quickly grasp the content. That’s where Zoho Analytics is very strong. We now analyze our sales, operations, and finance using Zoho Analytics."

Stephen Shorter
General Manager - Solutions Group, Viatek"For deeper and more concentrated analysis, Zoho Analytics is ideal. It directly integrates with Salesforce CRM and processes lots of data in a simple way. I can now slice and dice our sales data in a more presentable way."