Ask Zia for Data Analysts and Business Users
Ask Zia - Agentic AI simplifies the report and dashboard creation process. Data analysts and business users don't have to sift through many reports to understand the key insights. Ask Zia provides contextual insights that not only explain what is happening in your data but also highlight the underlying reasons behind those trends and anomalies.
On this Page
Creating Reports
Create insightful reports by describing your requirements. Ask Zia understands the analytical intent, generates suitable reports, applies relevant filters or groupings, and recommends follow-up views or questions, thereby making report building faster, smarter, and accessible to all users.
- Access the Ask Zia Portal from the side navigation panel. Ensure to enable the conversation mode.
- In the prompt section, describe what report you want to create. Examples: Show me the region sales trend report. Refer to the Constructing questionsarticle to learn how to frame effective prompts for generating reports and visualizations.
- To make the conversation more easier, Zia auto suggests a few questions based on your data. Click the more icon and then select the questions you want to ask. Zia will get you the answers.
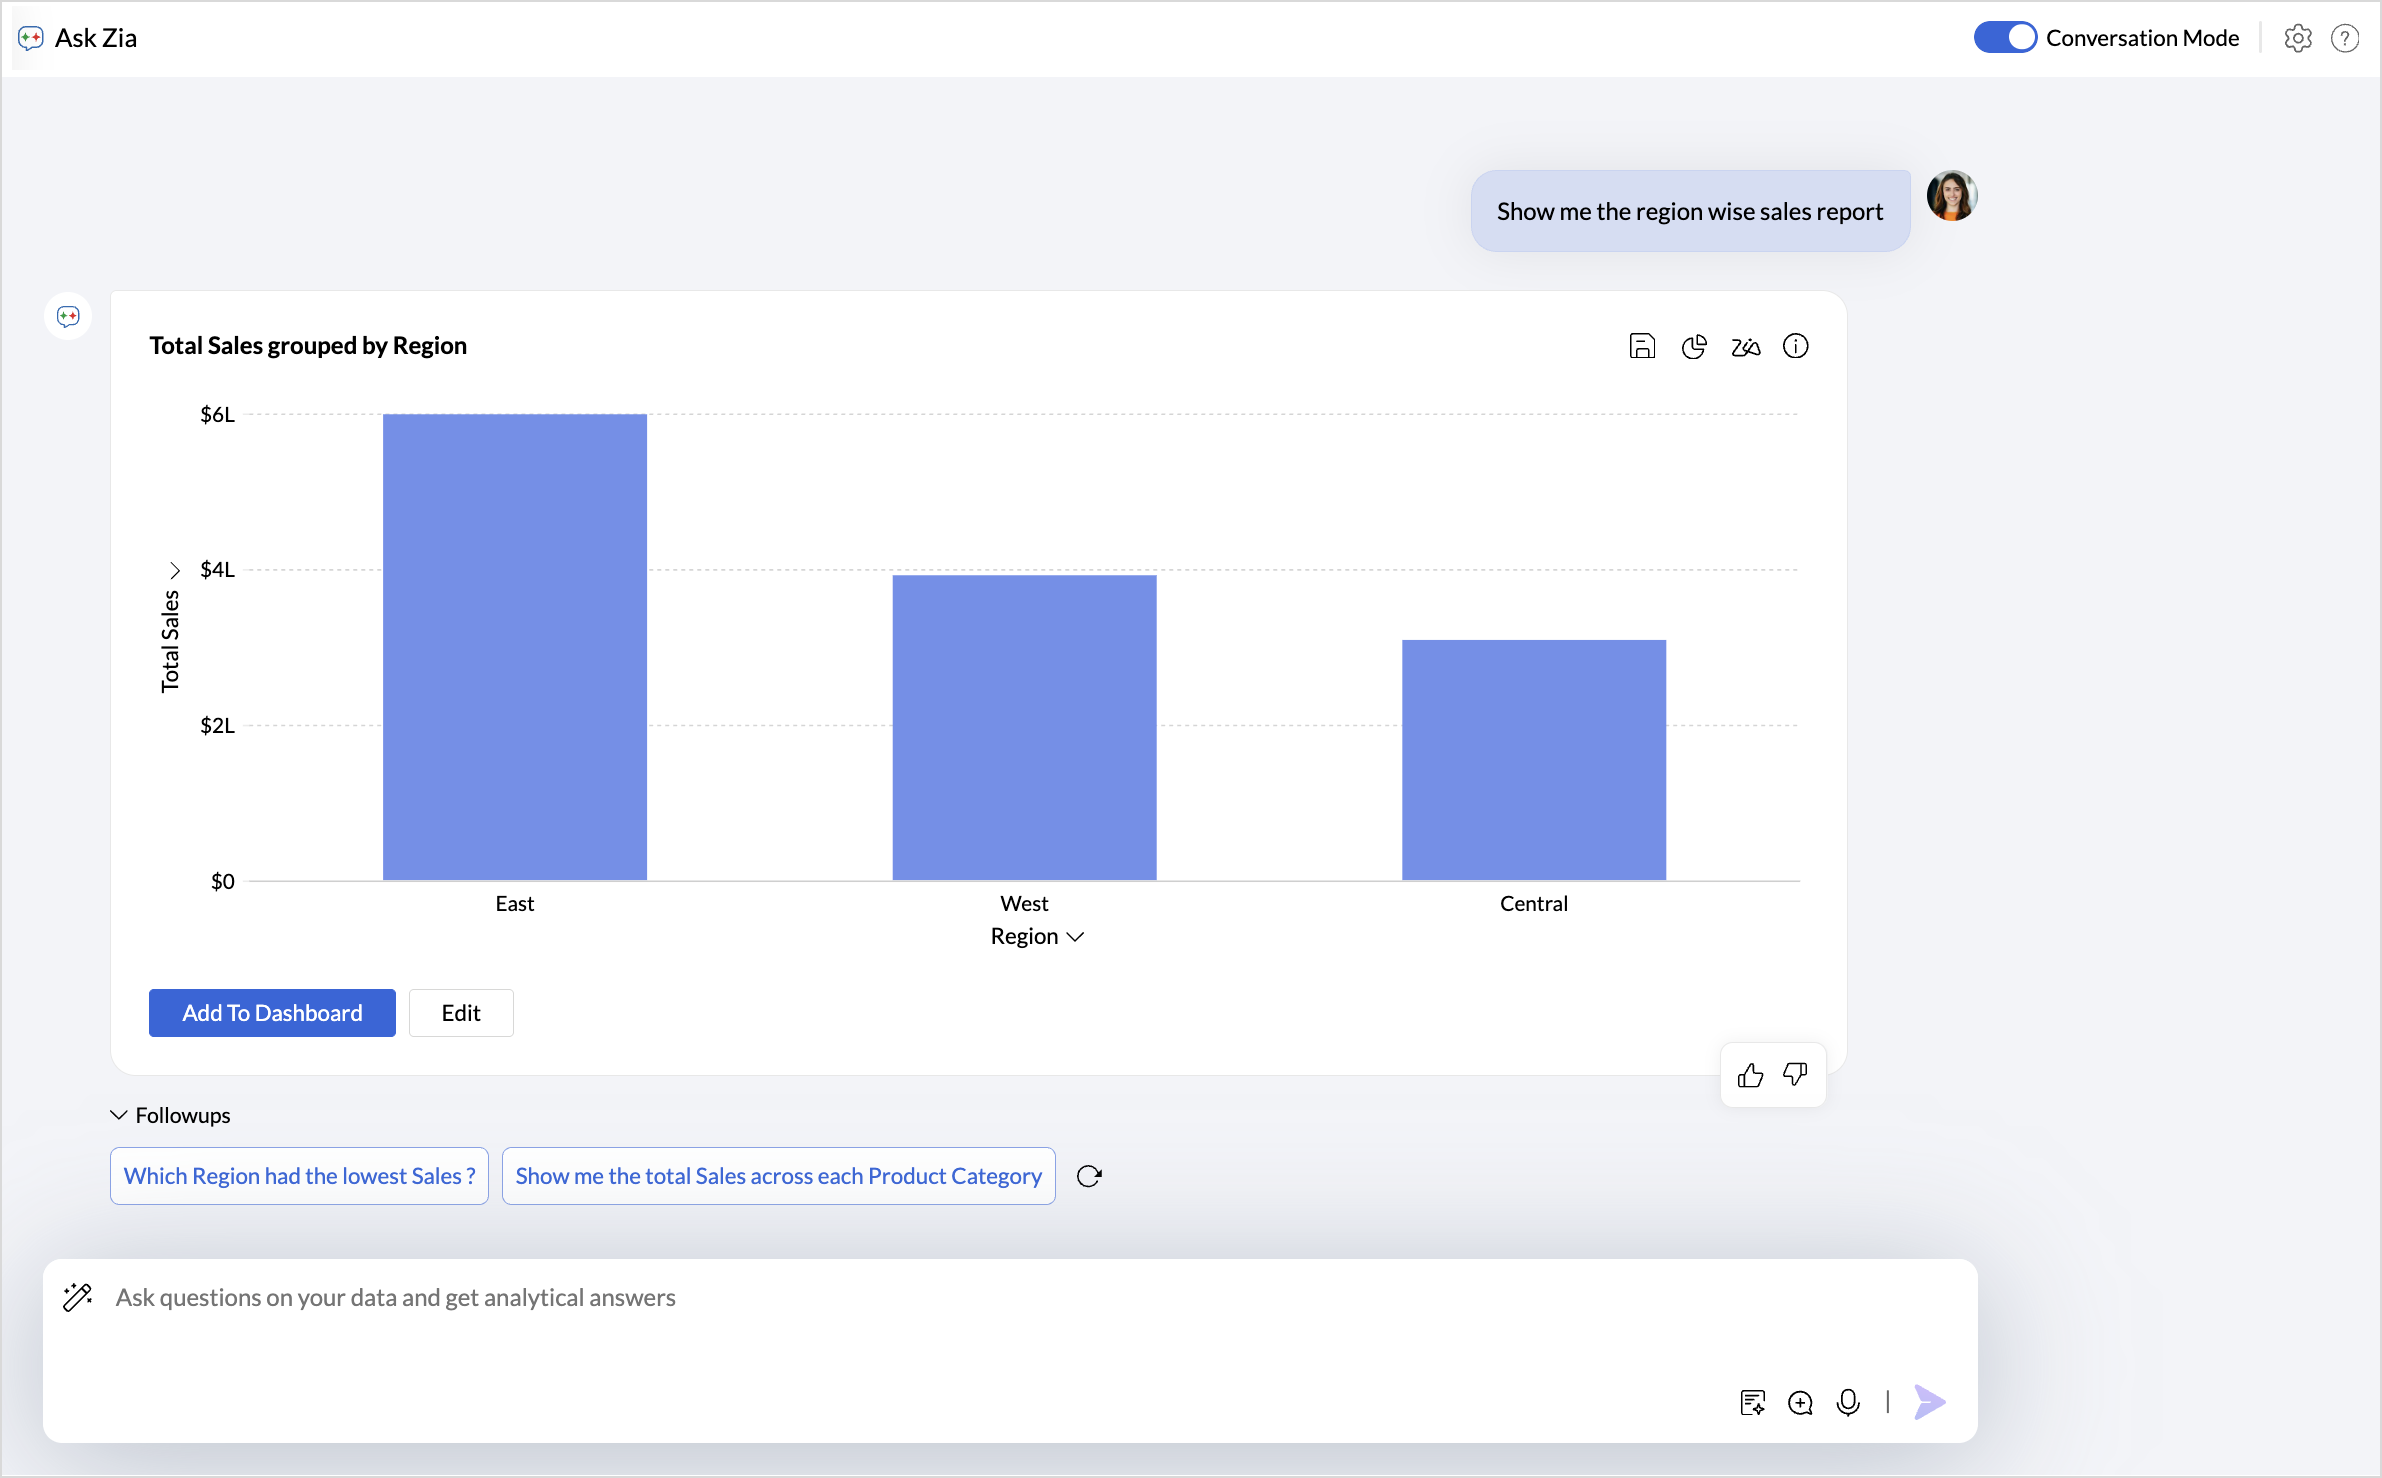
- Click the Save icon to add the reports to the workspace.
- Specify the View Name and choose the Folder Name where it should be saved.
- Click Save.
- The Change chart type option allows you to change and choose the suitable chart type.
- Zia insights provides a detailed summary of key insights in the report.
- The Edit option allows you to modify the report settings such as axes, legends, and more.
- The Add to Dashboard option allows you to include the reports in an existing dashboard in the workspace.
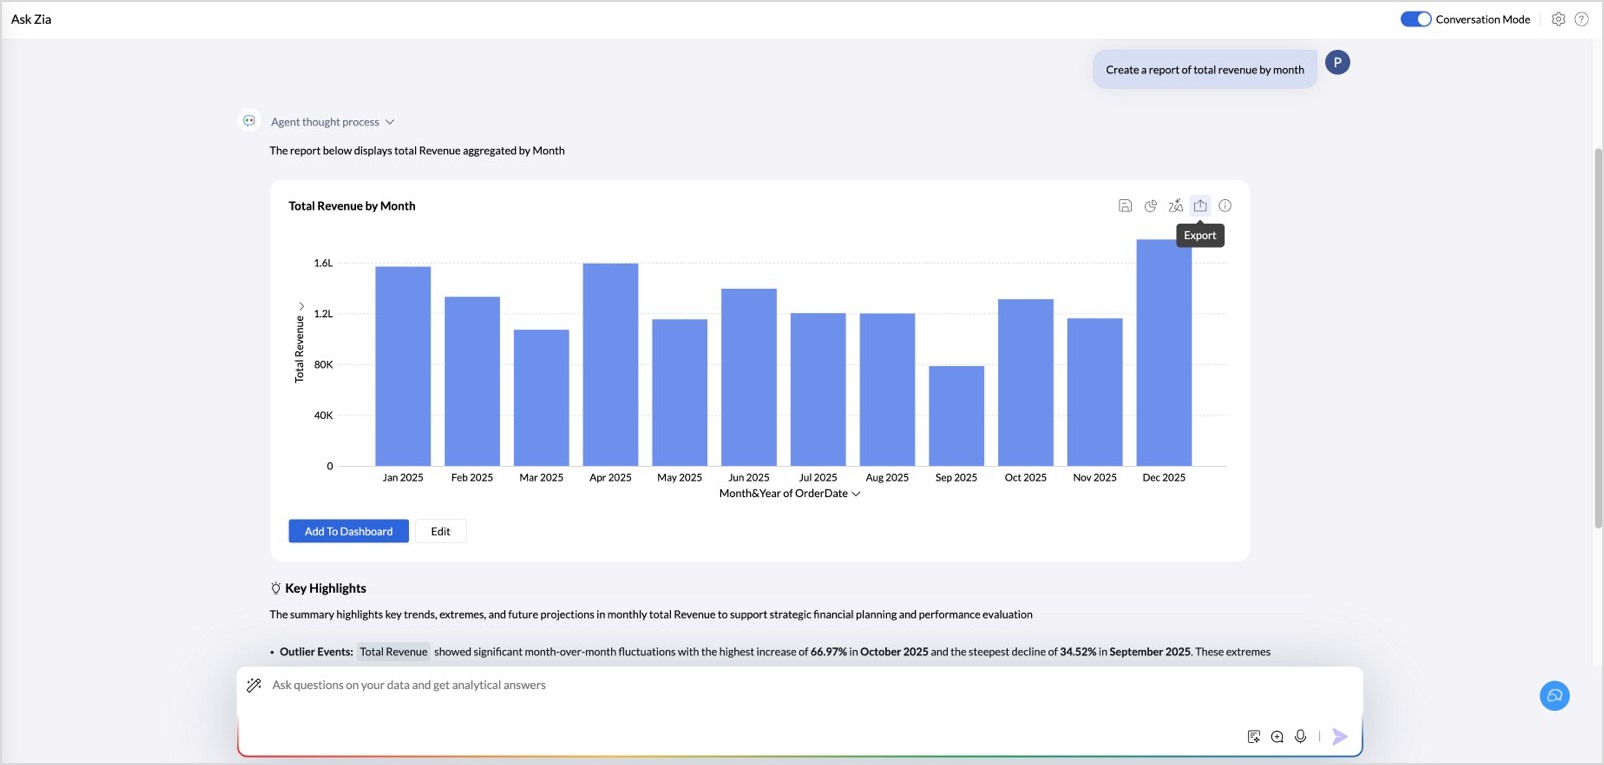
- The Export icon allows you to download the generated report.
Agent Thinking Process
The Agent Thought Process option allows you to view the reasoning steps Zia follows while generating a response. It provides transparency into how the AI interprets your question, understands the data model, and arrives at the final output.
Zia displays the intermediate steps it performs during the analysis. This can include identifying relevant tables and columns, interpreting the metrics and dimensions mentioned in the query, determining the appropriate aggregation, and constructing the report or analysis needed to answer the question.
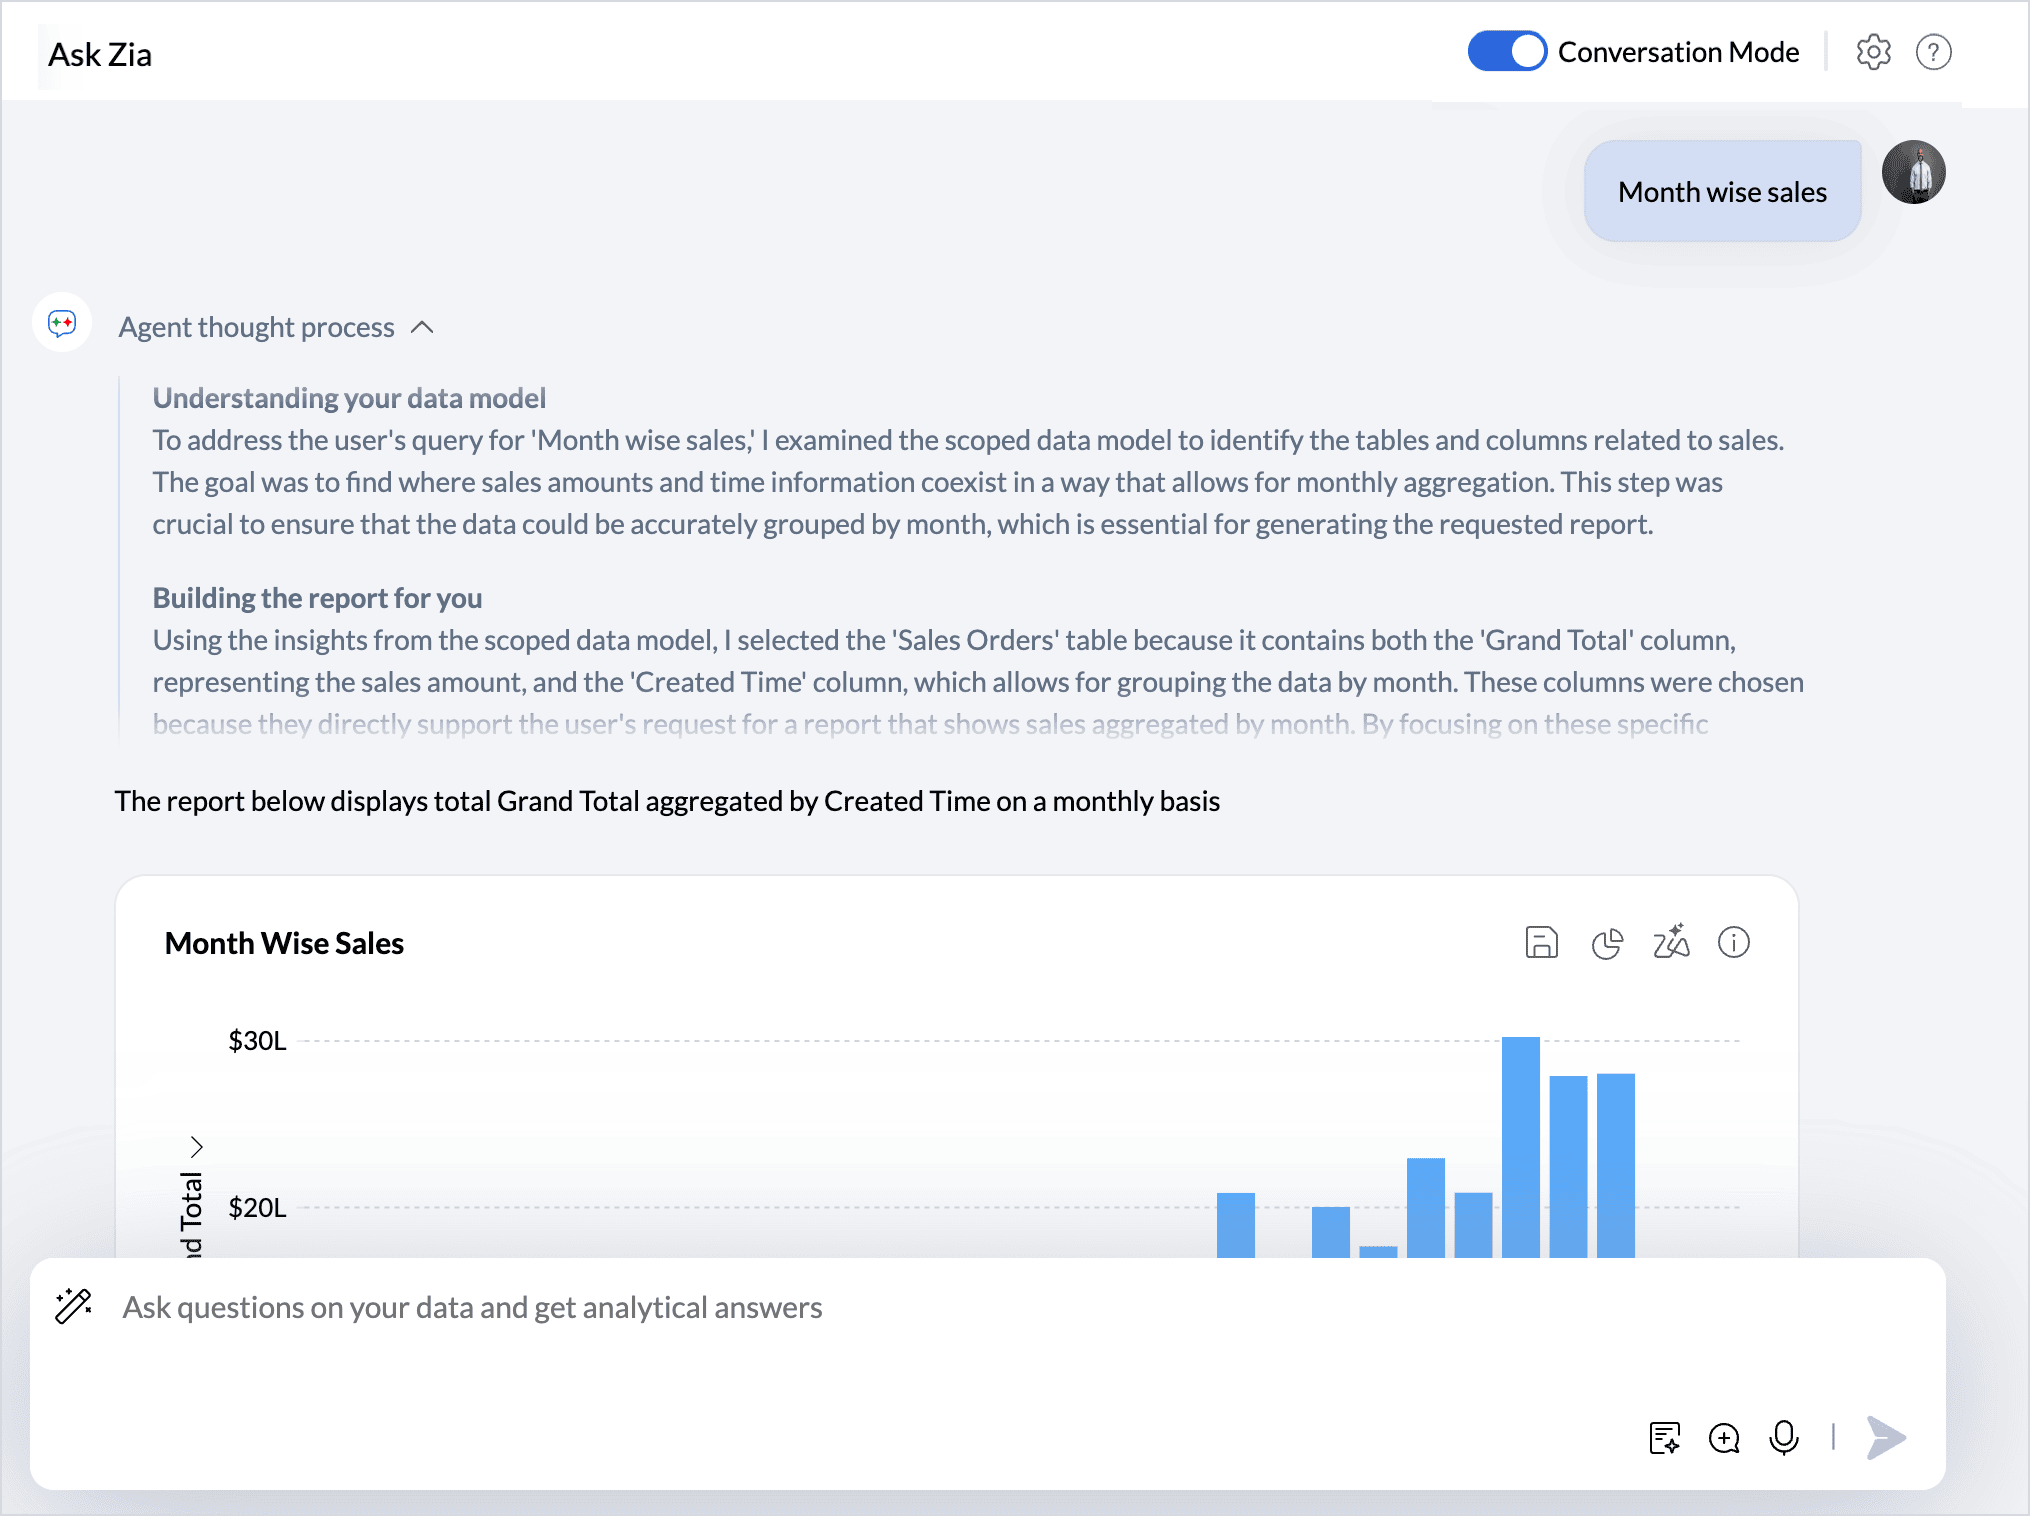
For example, when a user asks for month-wise sales, Zia first examines the data model to locate the tables that contain sales and date information. It then determines how the sales metric should be aggregated and how the date column can be grouped by month. Based on this understanding, Zia generates the report showing sales by month.
This can be useful for validating the logic behind the response and gaining deeper insight into the analysis performed.
Key Highlights
Key highlights summarizes the most important insights from a report or chart, helping users quickly understand the key patterns in the data.
The insights are generated using the chart metadata, including the metric, dimensions, and aggregated values already present in the visualization. No additional columns or external data are introduced during this process, ensuring that the insights strictly reflect what is shown in the chart.
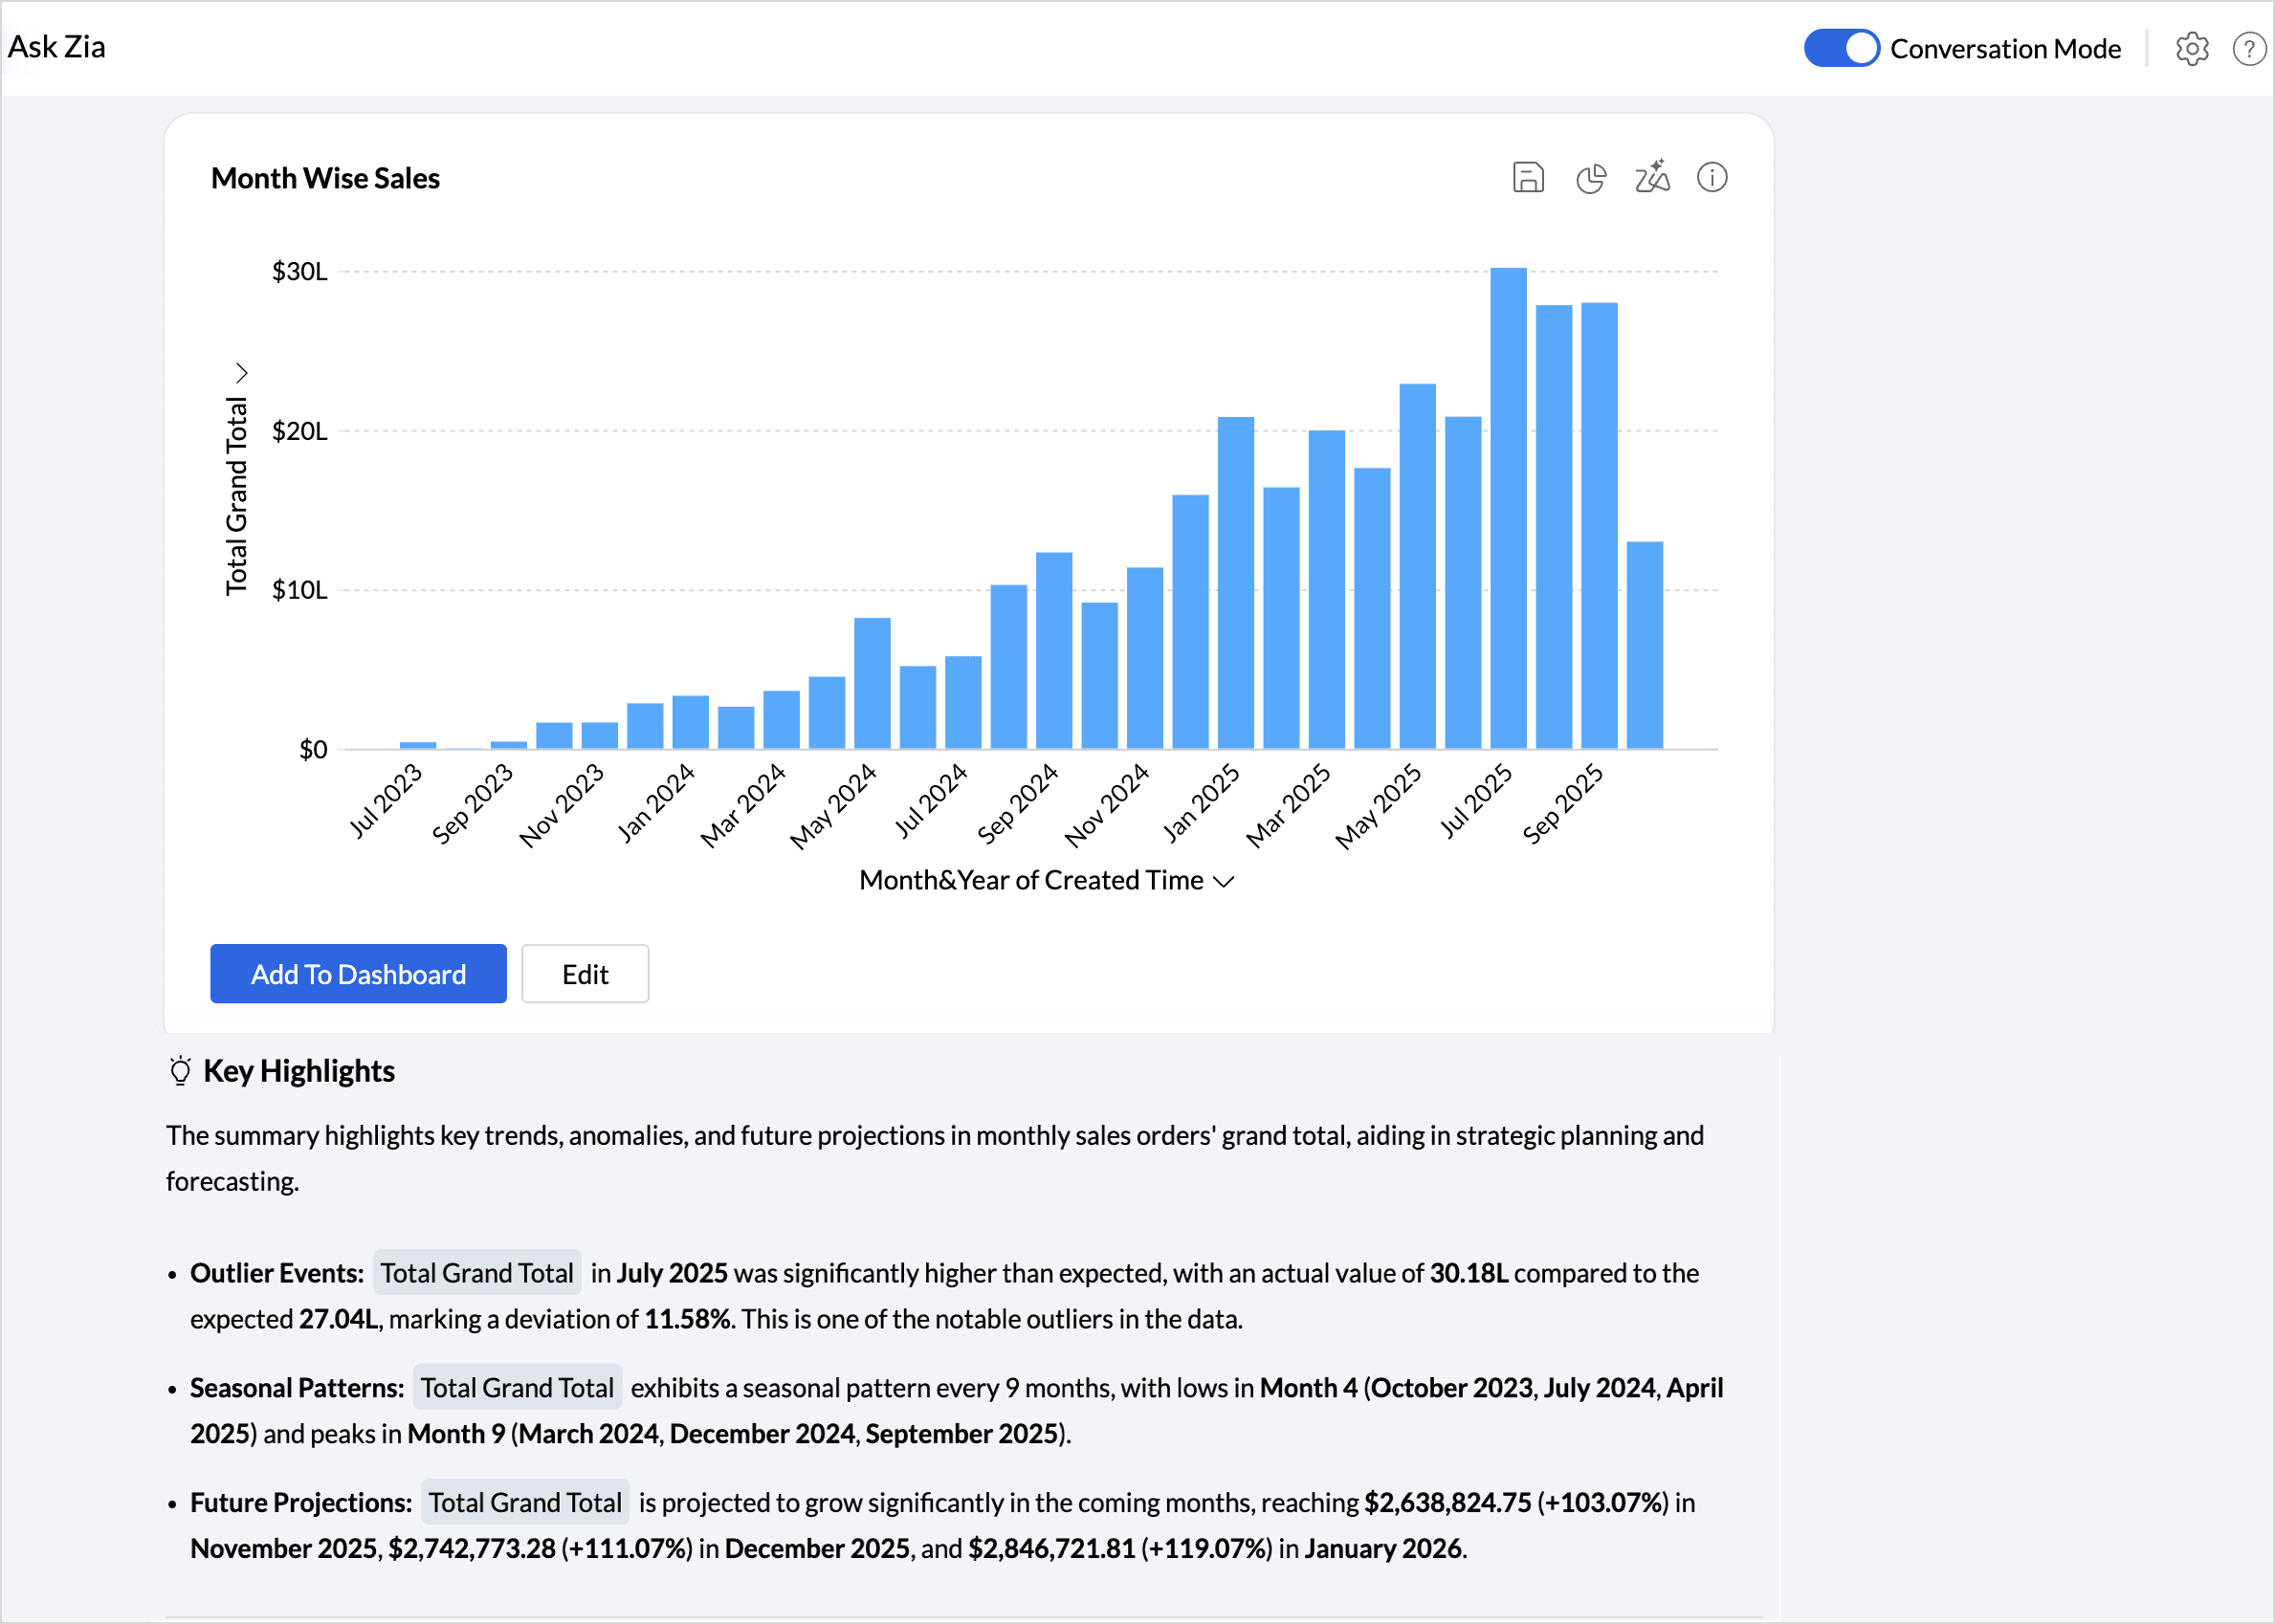
Based on this metadata, the system identifies relevant analytical observations such as contribution, comparisons between entities, trends over time, and forecast-related observations where applicable. These analytical findings are then sent to a Large Language Model (LLM) to generate a clear and concise natural language summary.
This enables users to instantly grasp the key takeaways from the chart without having to analyze the visualization manually.
Creating Dashboards
Whether you’re building dashboards from scratch or enhancing existing dashboards, Ask Zia understands your layout preferences, content needs, and visual goals and delivers a personalized experience every step of the way.
From the Ask Zia Portal
- Access the Ask Zia Portal from the side navigation panel.
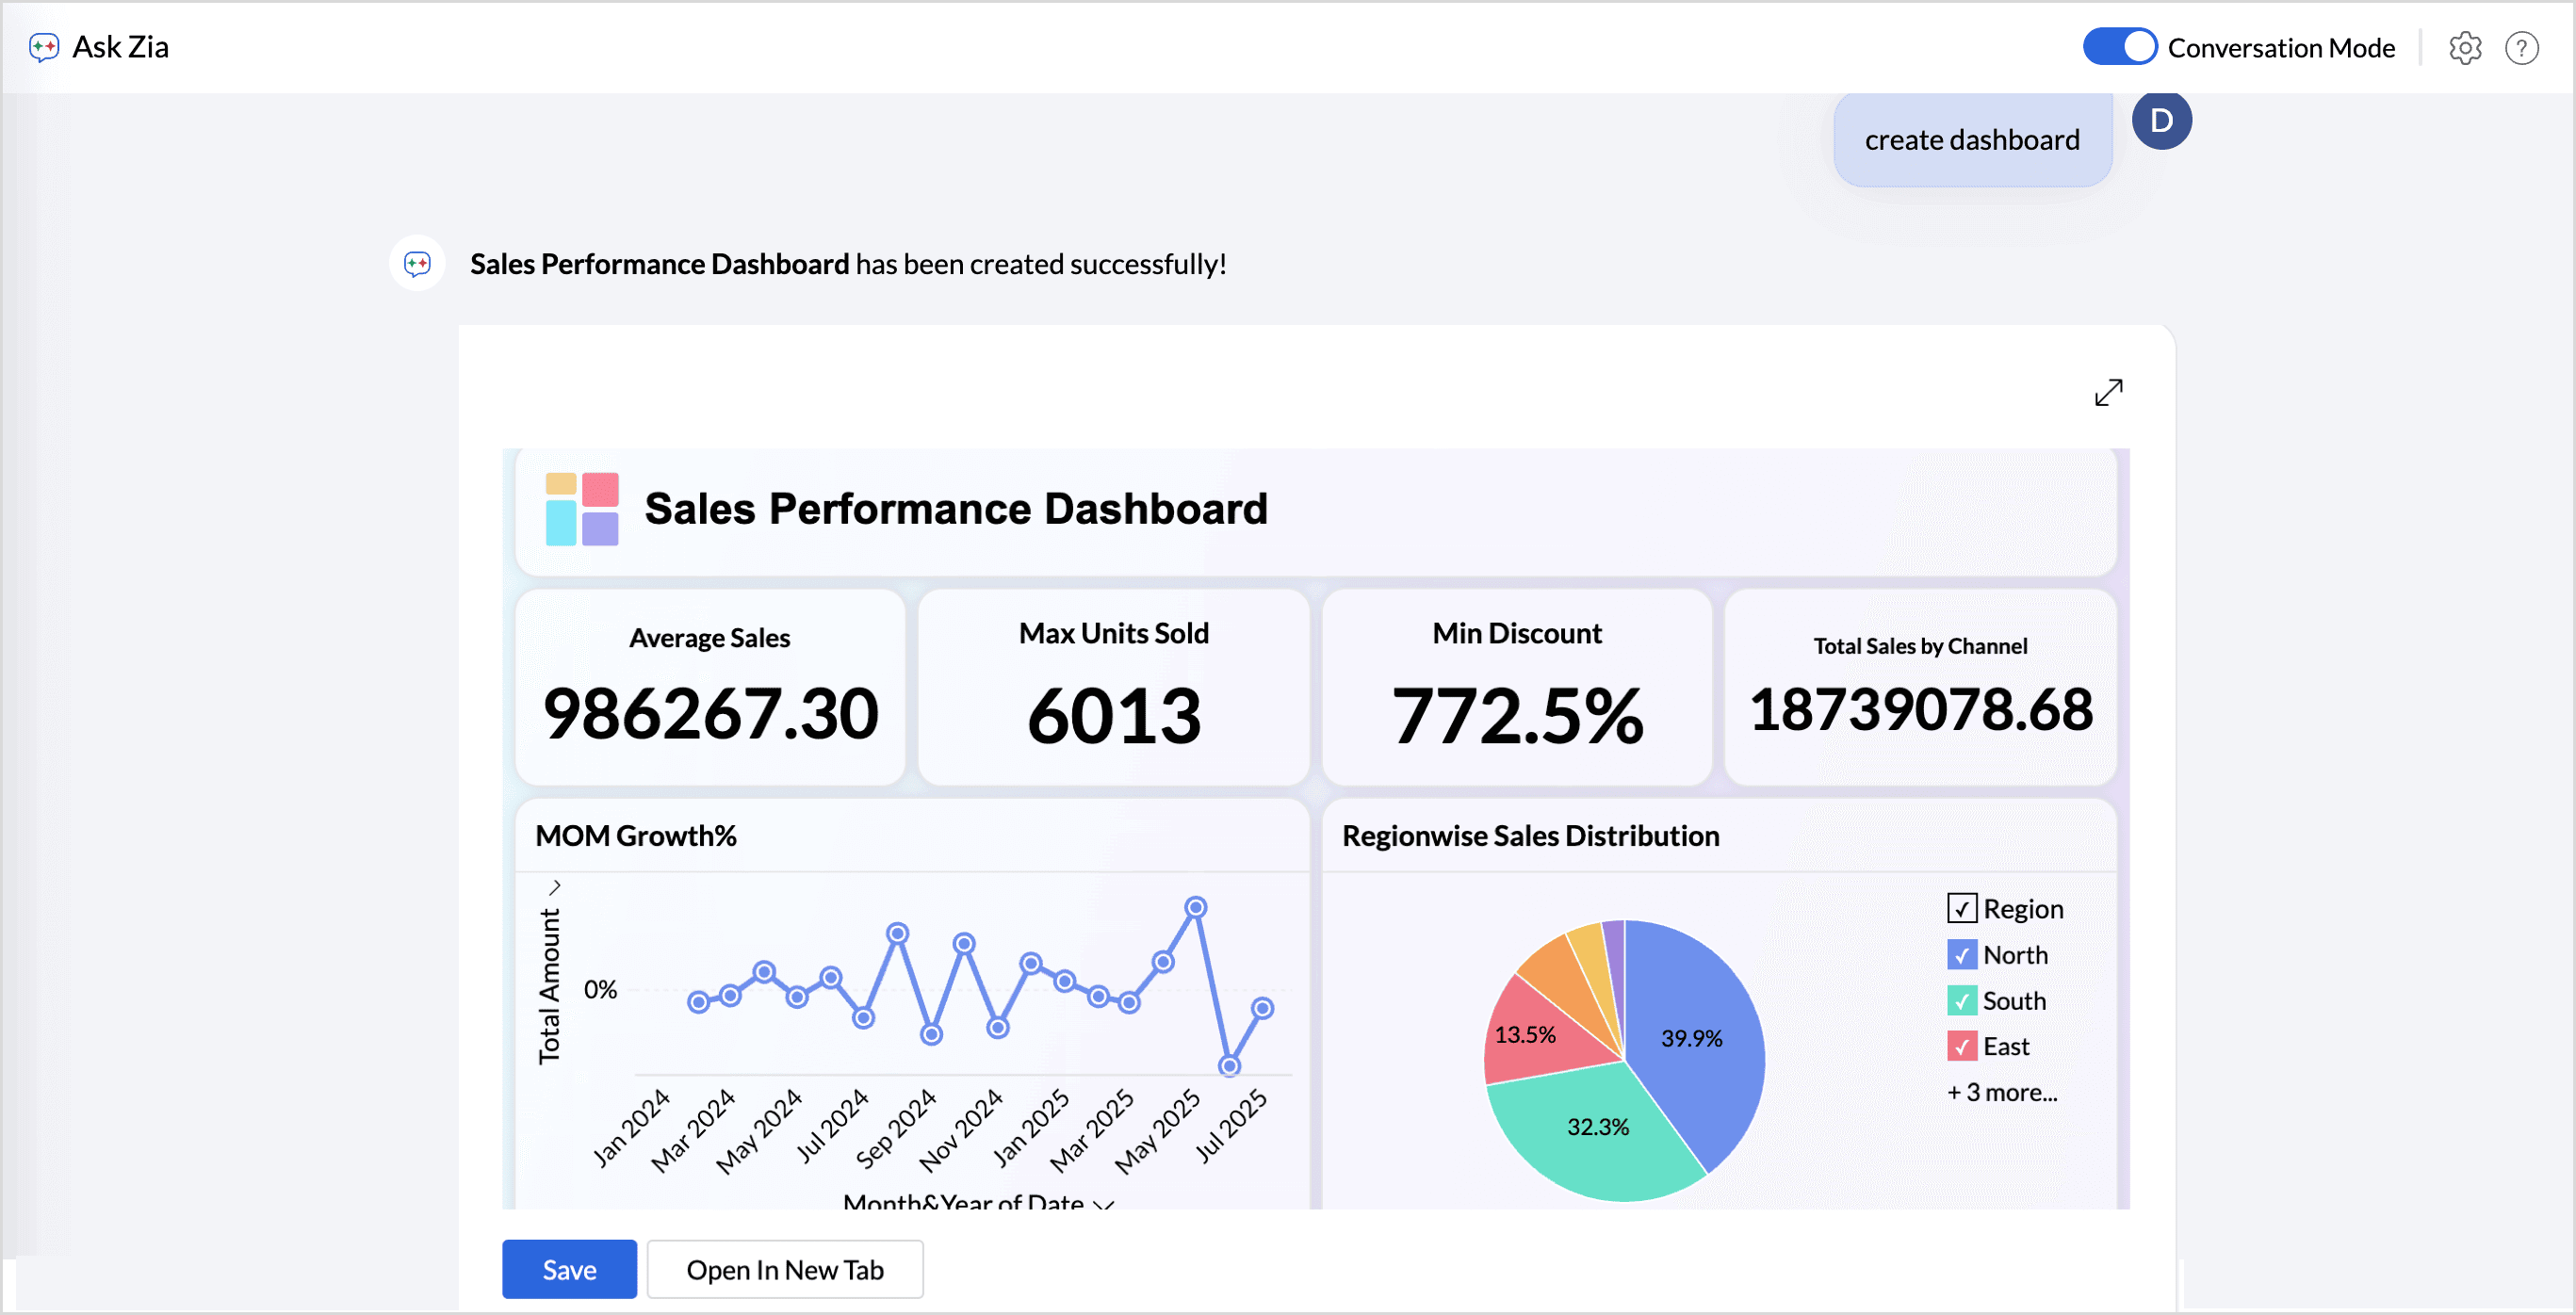
- In the prompt section, provide the details about the metrics to be used for the dashboard creation. Example: Create a dashboard using sales metrics.
- Click Save to add the reports to the workspace.
- Click Open in a new tab to modify the dashboard settings.
- Specify the details on customizing the dashboards in the prompt section.
- Layout: Specify how the charts and widgets are to be arranged on the dashboard, whether single, double, or custom column layout.
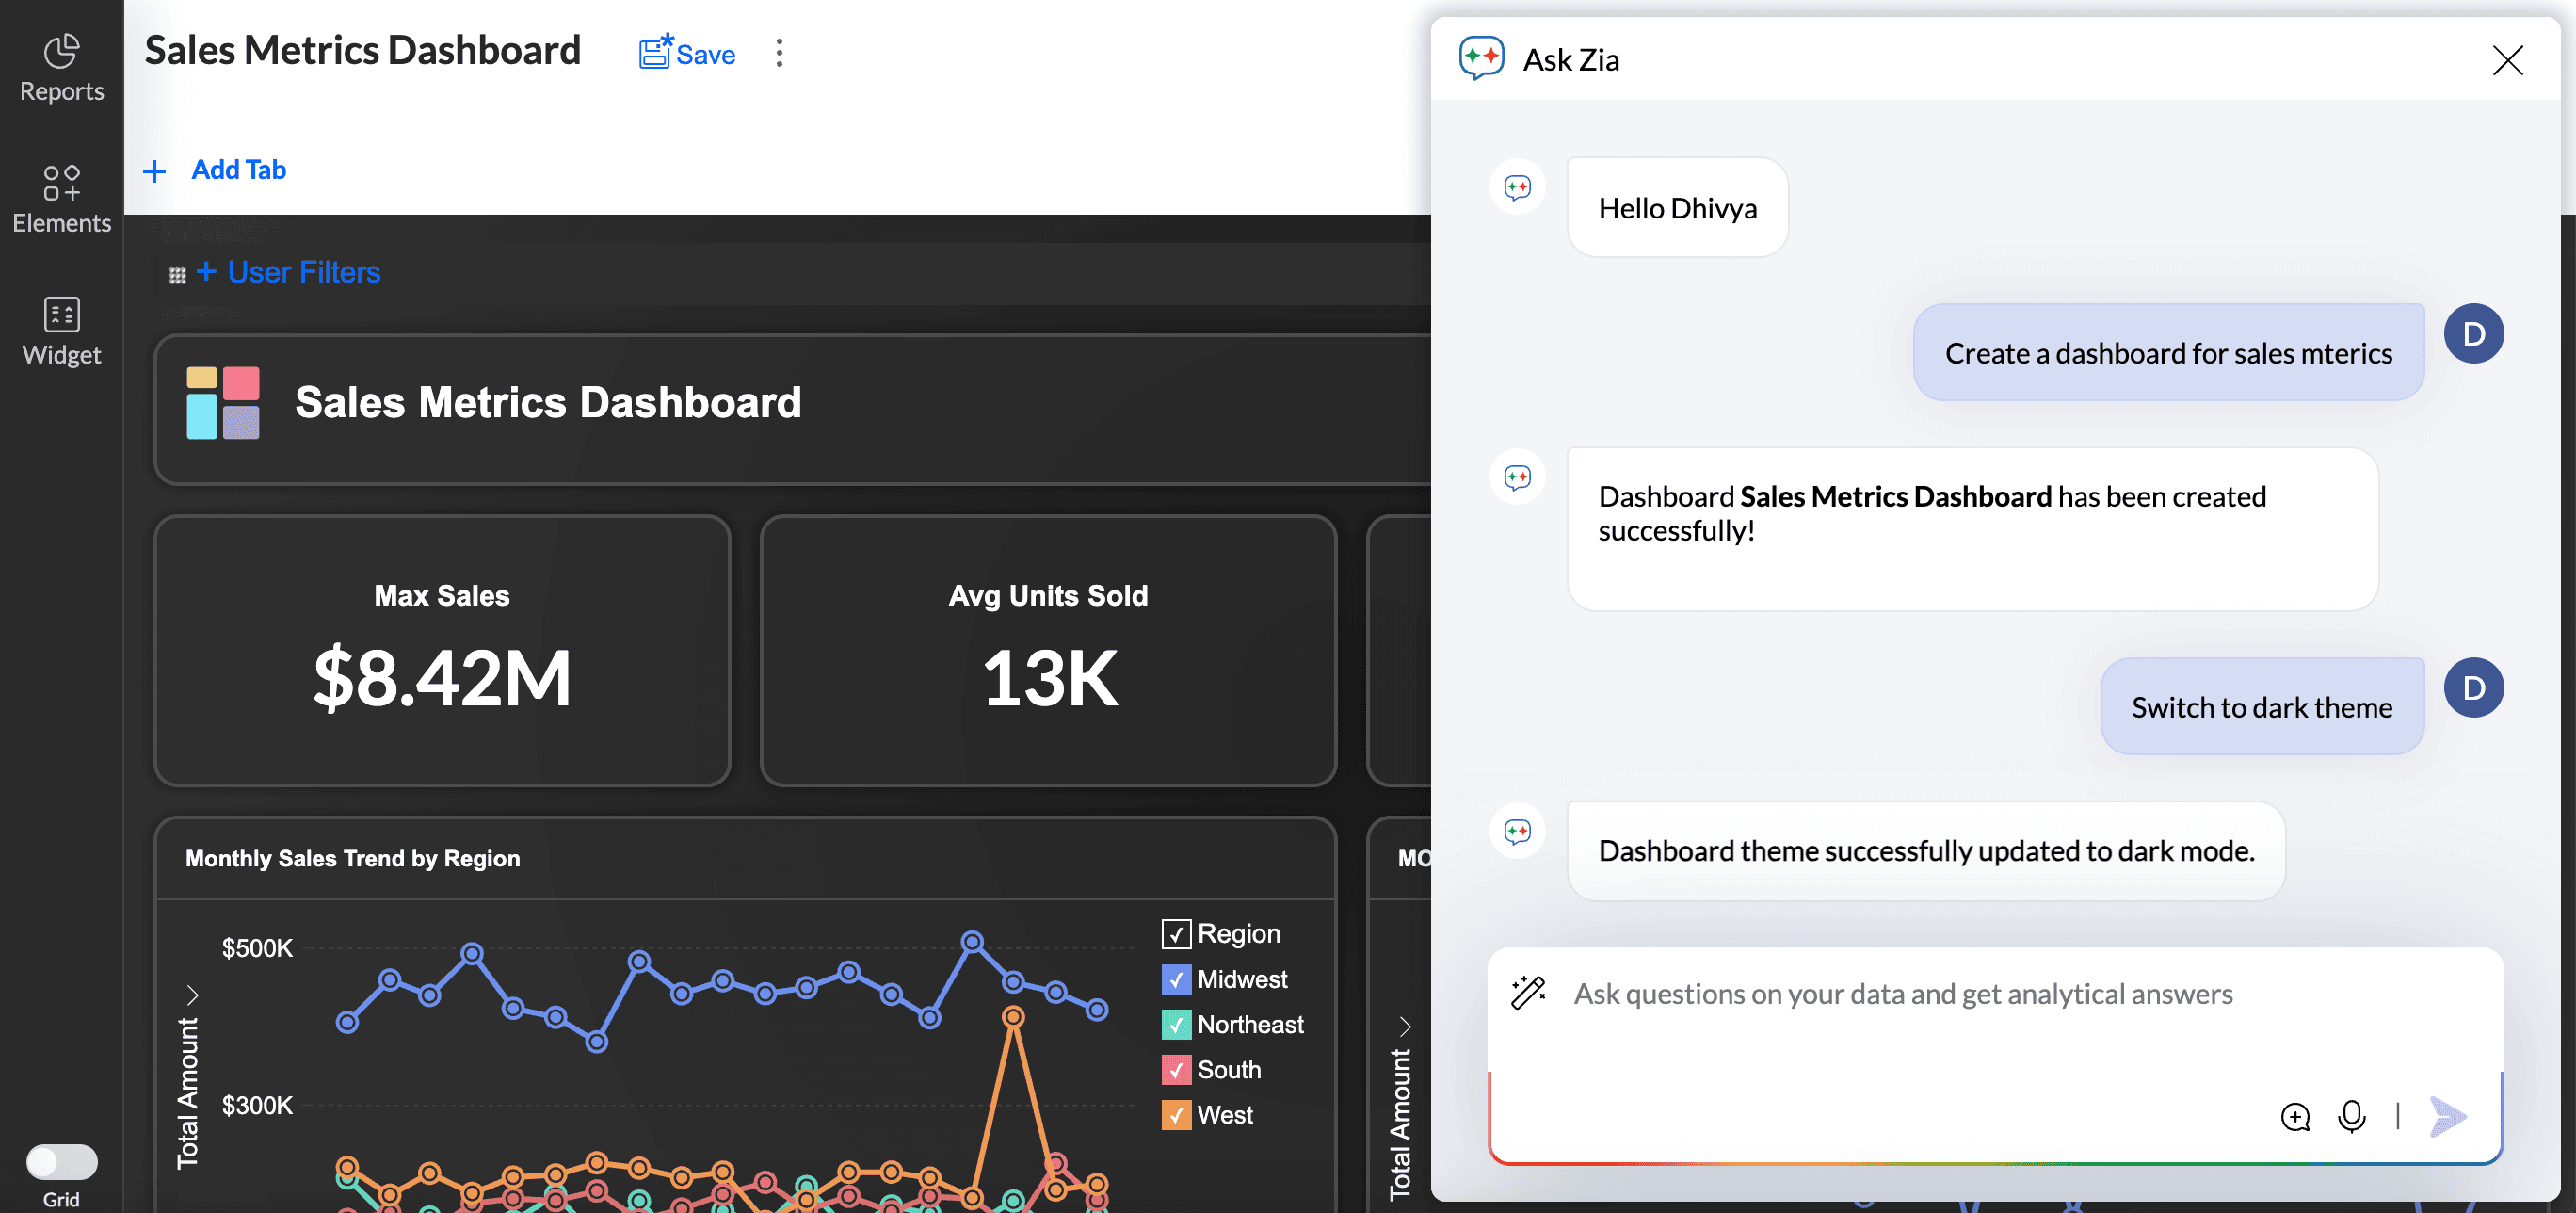
- Switch Themes: Customize the dashboard appearance by specifying the preferred theme. Example: Switch to Dark Theme.
- Add or Remove Views: Include or exclude specific charts, KPIs, or visualizations as needed to refine your dashboard. Example: Add sales by region report.
From the Dashboard Designer
- Click Create > Dashboard on the side navigation panel.
- In the prompt section, provide the details about the metrics to be used for the dashboard creation. Example: Create a dashboard using sales metrics.
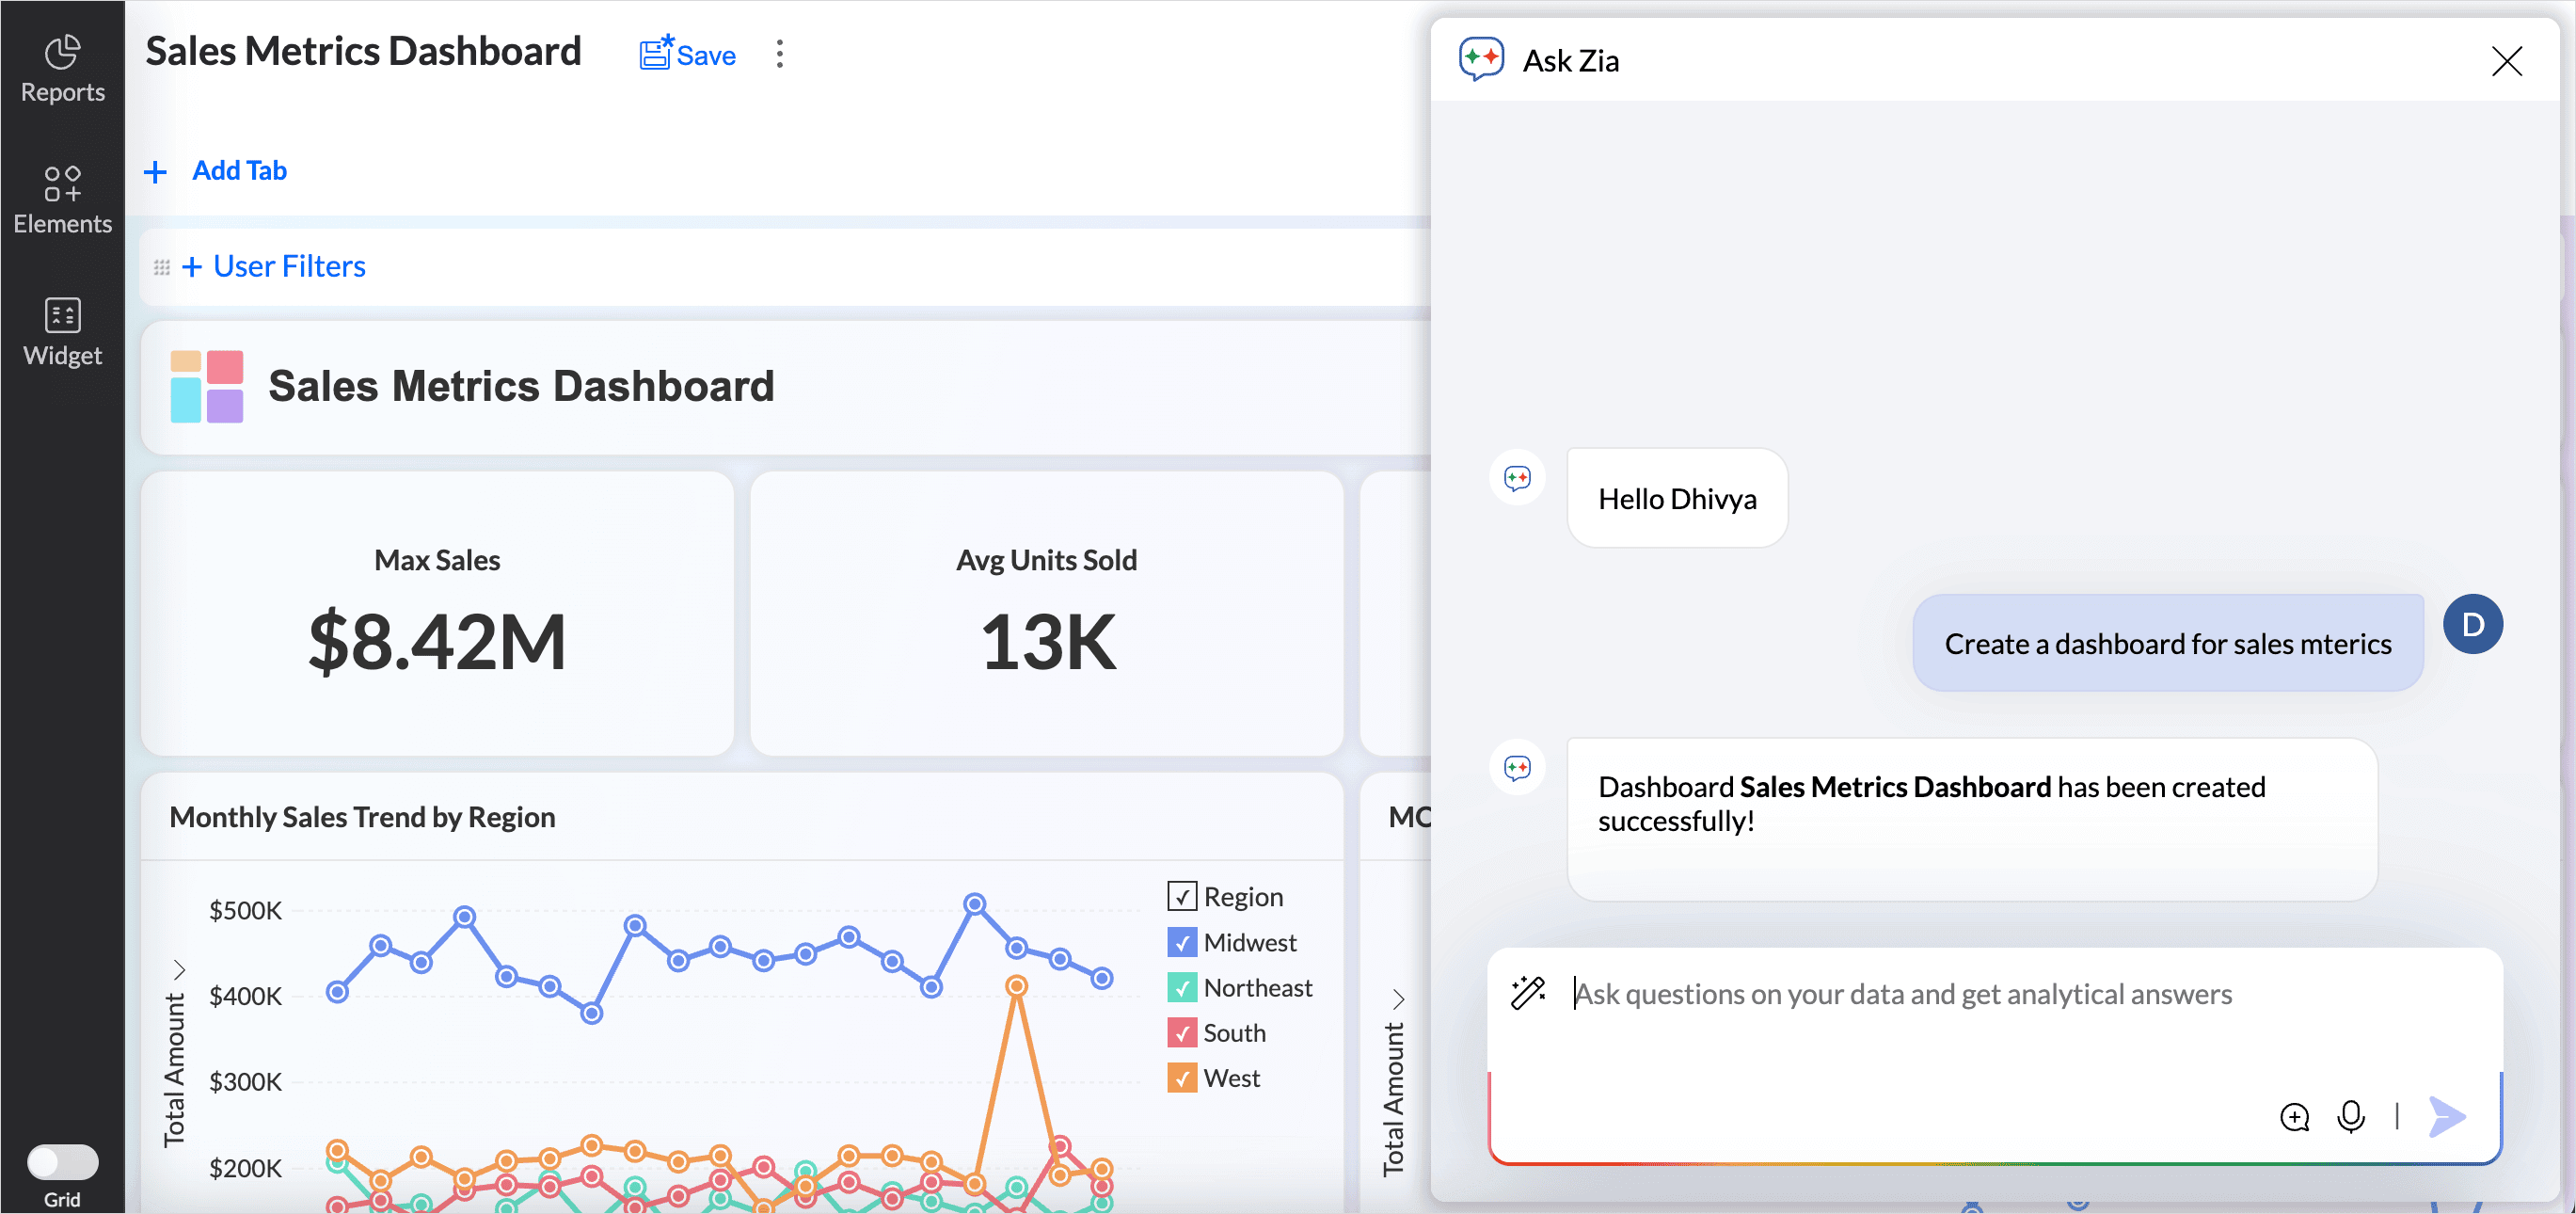
- Prompts executed here are reflected in real time on the dashboard canvas.
- Customize the dashboard design as per your preferences. Refer to the above section to learn more.
Explore Data Insights with Ask Zia
The conversational interface in Ask Zia allows users to explore data using simple language. It offers a closer lens into what has happened, why it happened, and what’s likely to happen along with recommendations to guide your next steps.
Creating Slideshows
Convert reports and dashboards into compelling, narrative-driven slideshows with Ask Zia.
- Access the Ask Zia Portal from the side navigation panel. Ensure to enable the conversation mode.
- In the prompt section, describe the slideshow details you want to create. Examples: Construct a slideshow using sales metrics.
- Click the drop - down icon to view the reports used in the slideshow. you can easily add or remove views from the slideshow.
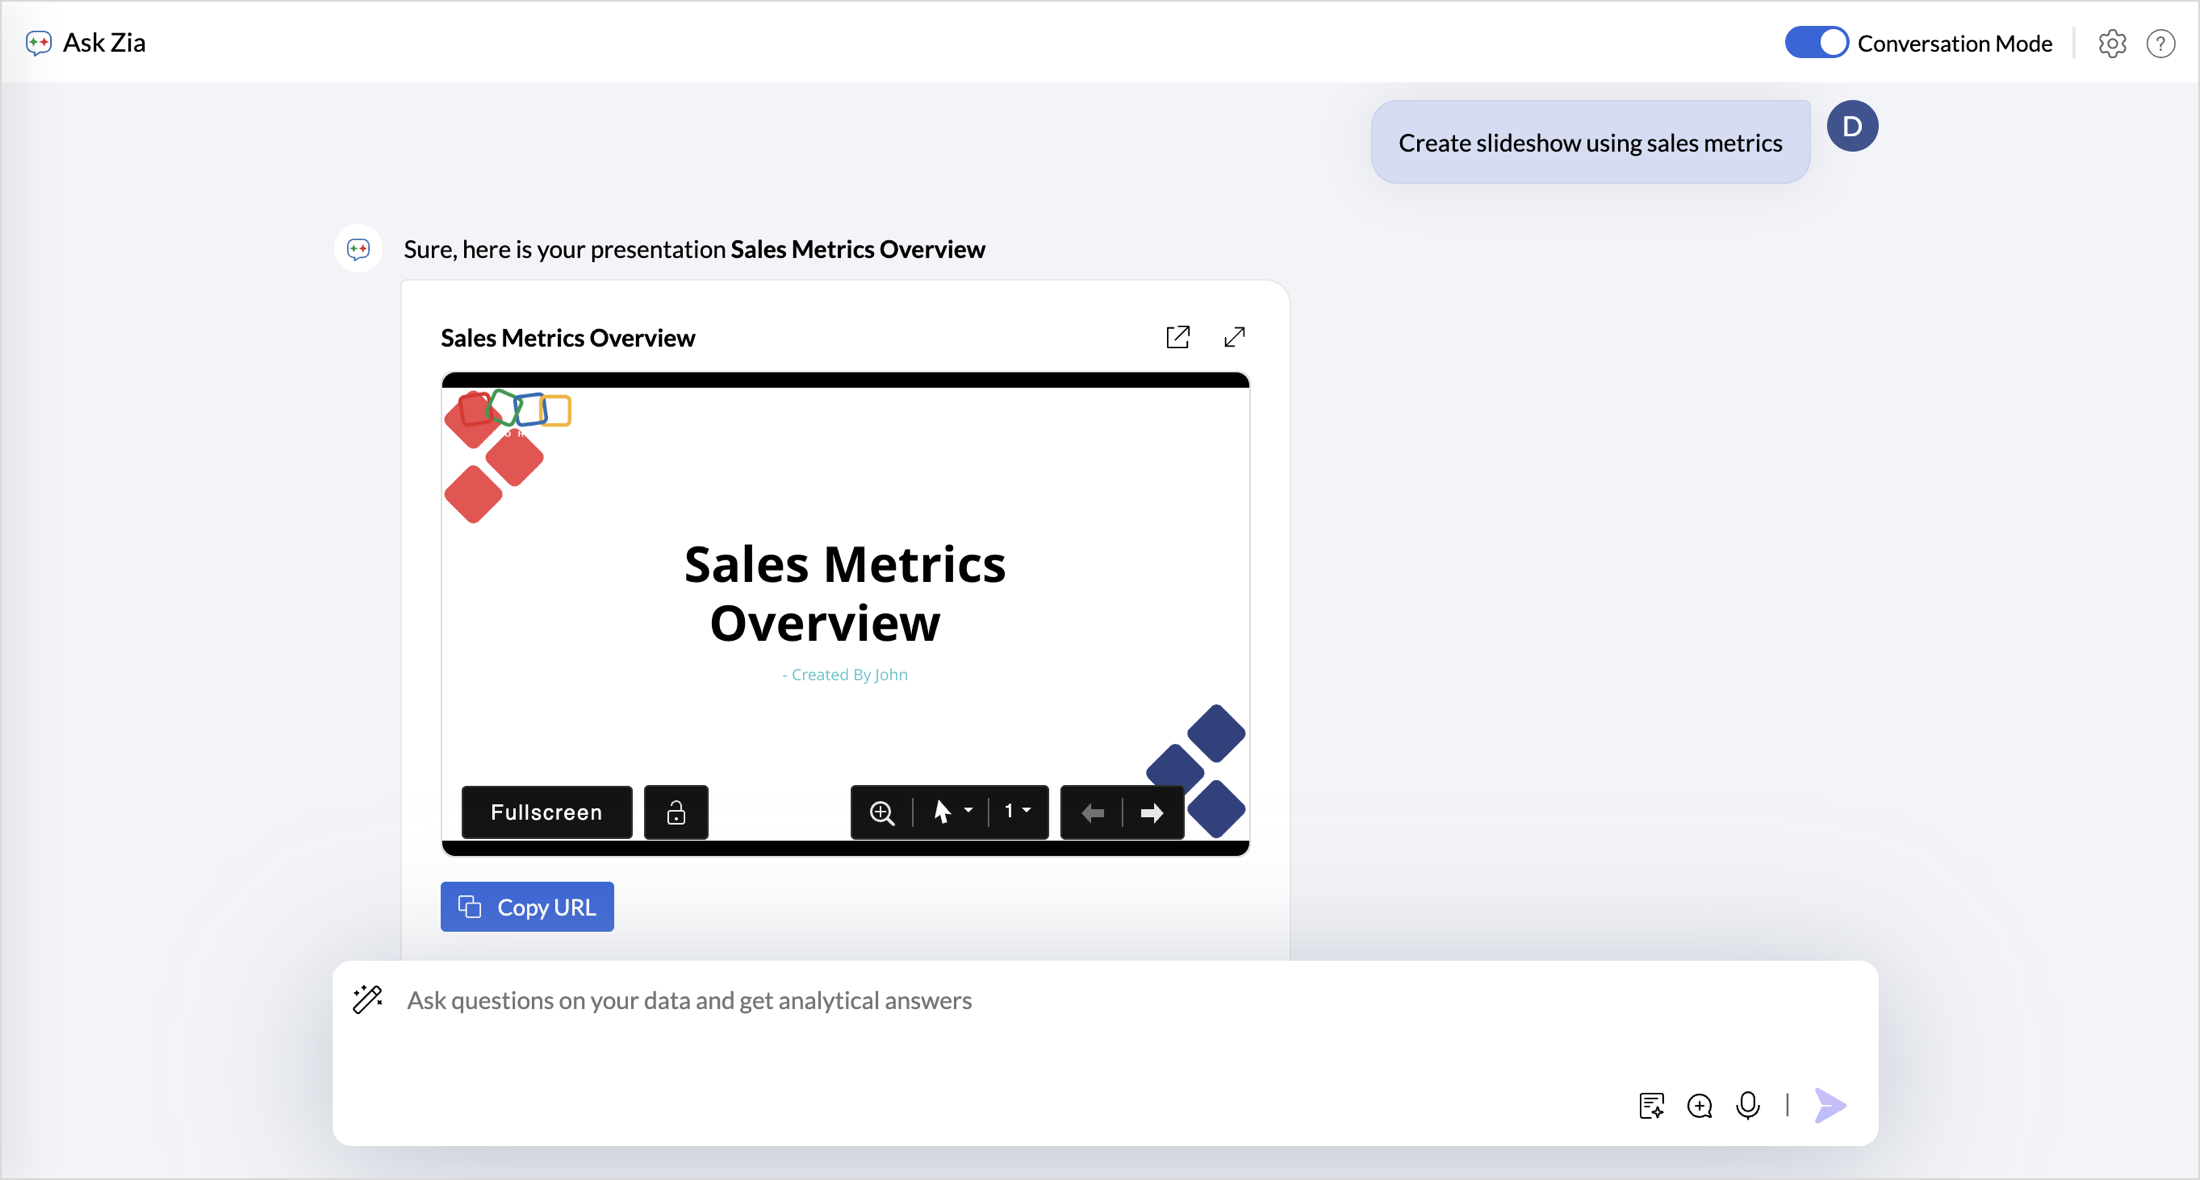
- Click Open in new tab to view the slideshow.
- Rename the slideshow by specifying the preferred slideshow name in the prompt.
Provide Feedback on Zia’s Responses
Zia Insights allows you to provide feedback on the responses it generates. Your feedback helps improve the accuracy and relevance of future insights.
Each time Zia generates a response, you can rate its quality using the thumbs up (👍) or thumbs down (👎) icons.
- Thumbs Up – Select this if the insight or explanation was helpful and accurately addressed your query.
Thumbs Down – Select this if you’re not satisfied. This will open a follow-up box asking for the reason, which helps improve Zia’s future performance.
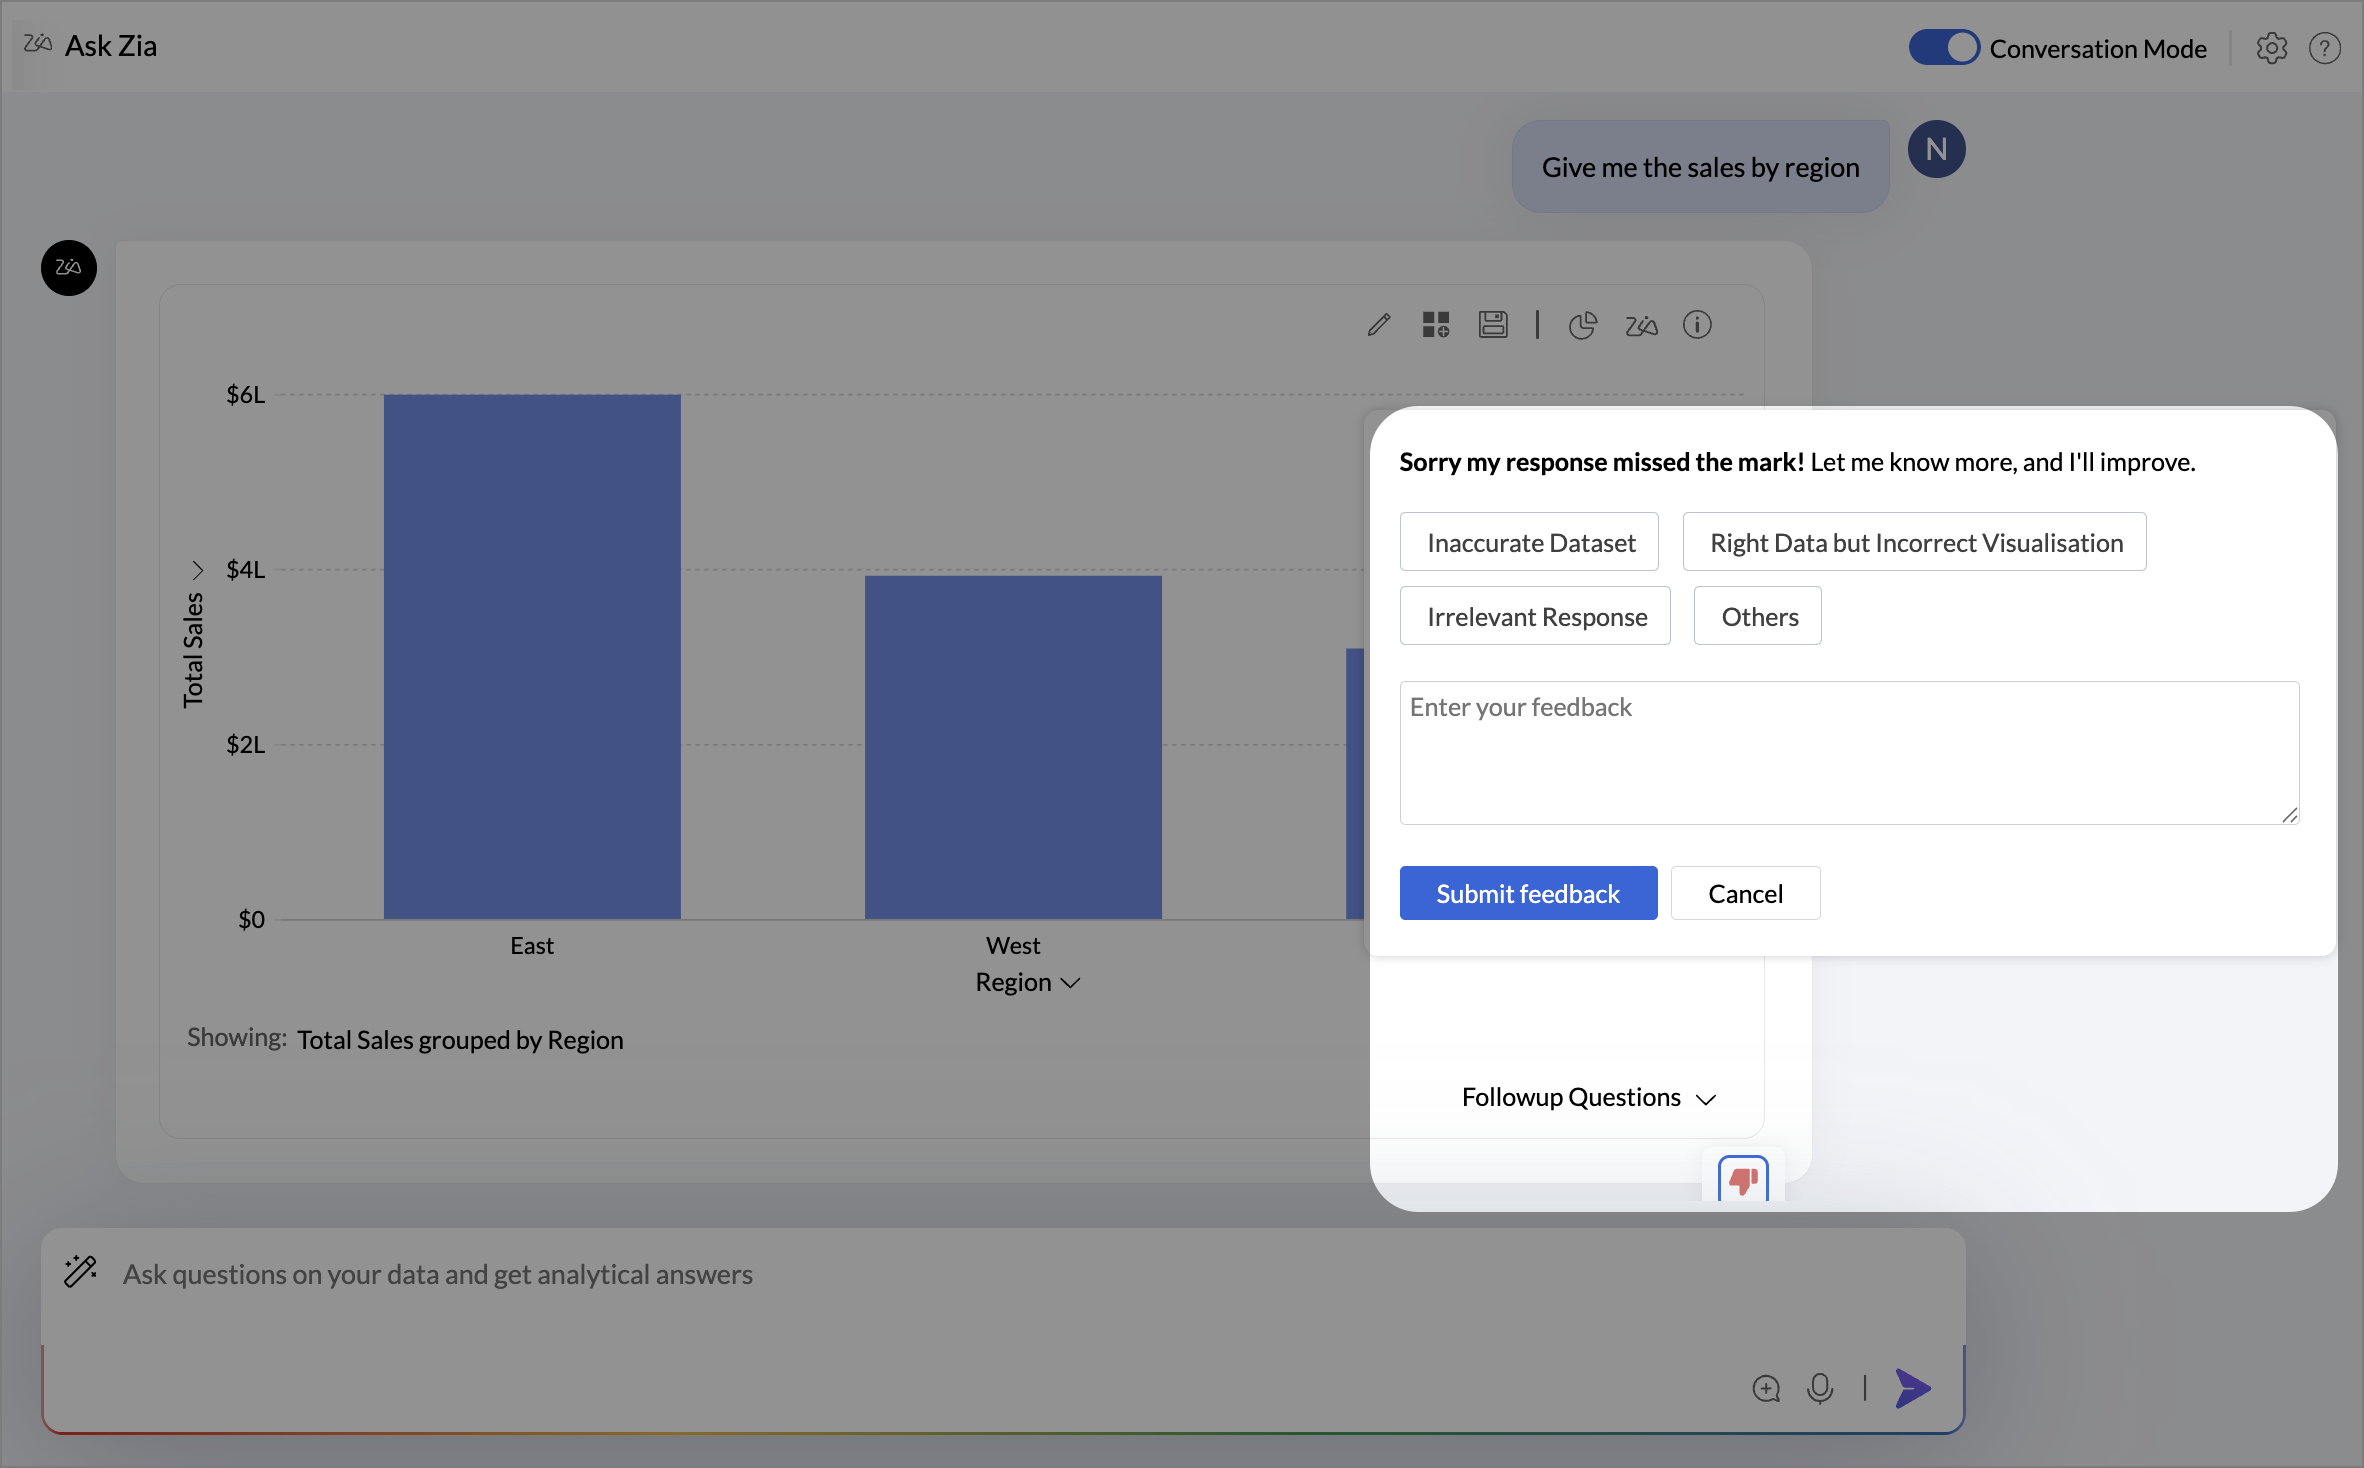
Providing feedback helps improve Zia’s ability to generate more accurate, relevant, and useful insights over time.
