Voice analytics
The Voice Analytics dashboard in Zoho CPaaS gives you a view of your outbound call activity and outcomes over a selected time range. It tracks the full lifecycle of a call from initiation through to whether it was answered, unanswered, or failed, so that you can monitor performance and diagnose issues quickly.
Voice analytics dashboard
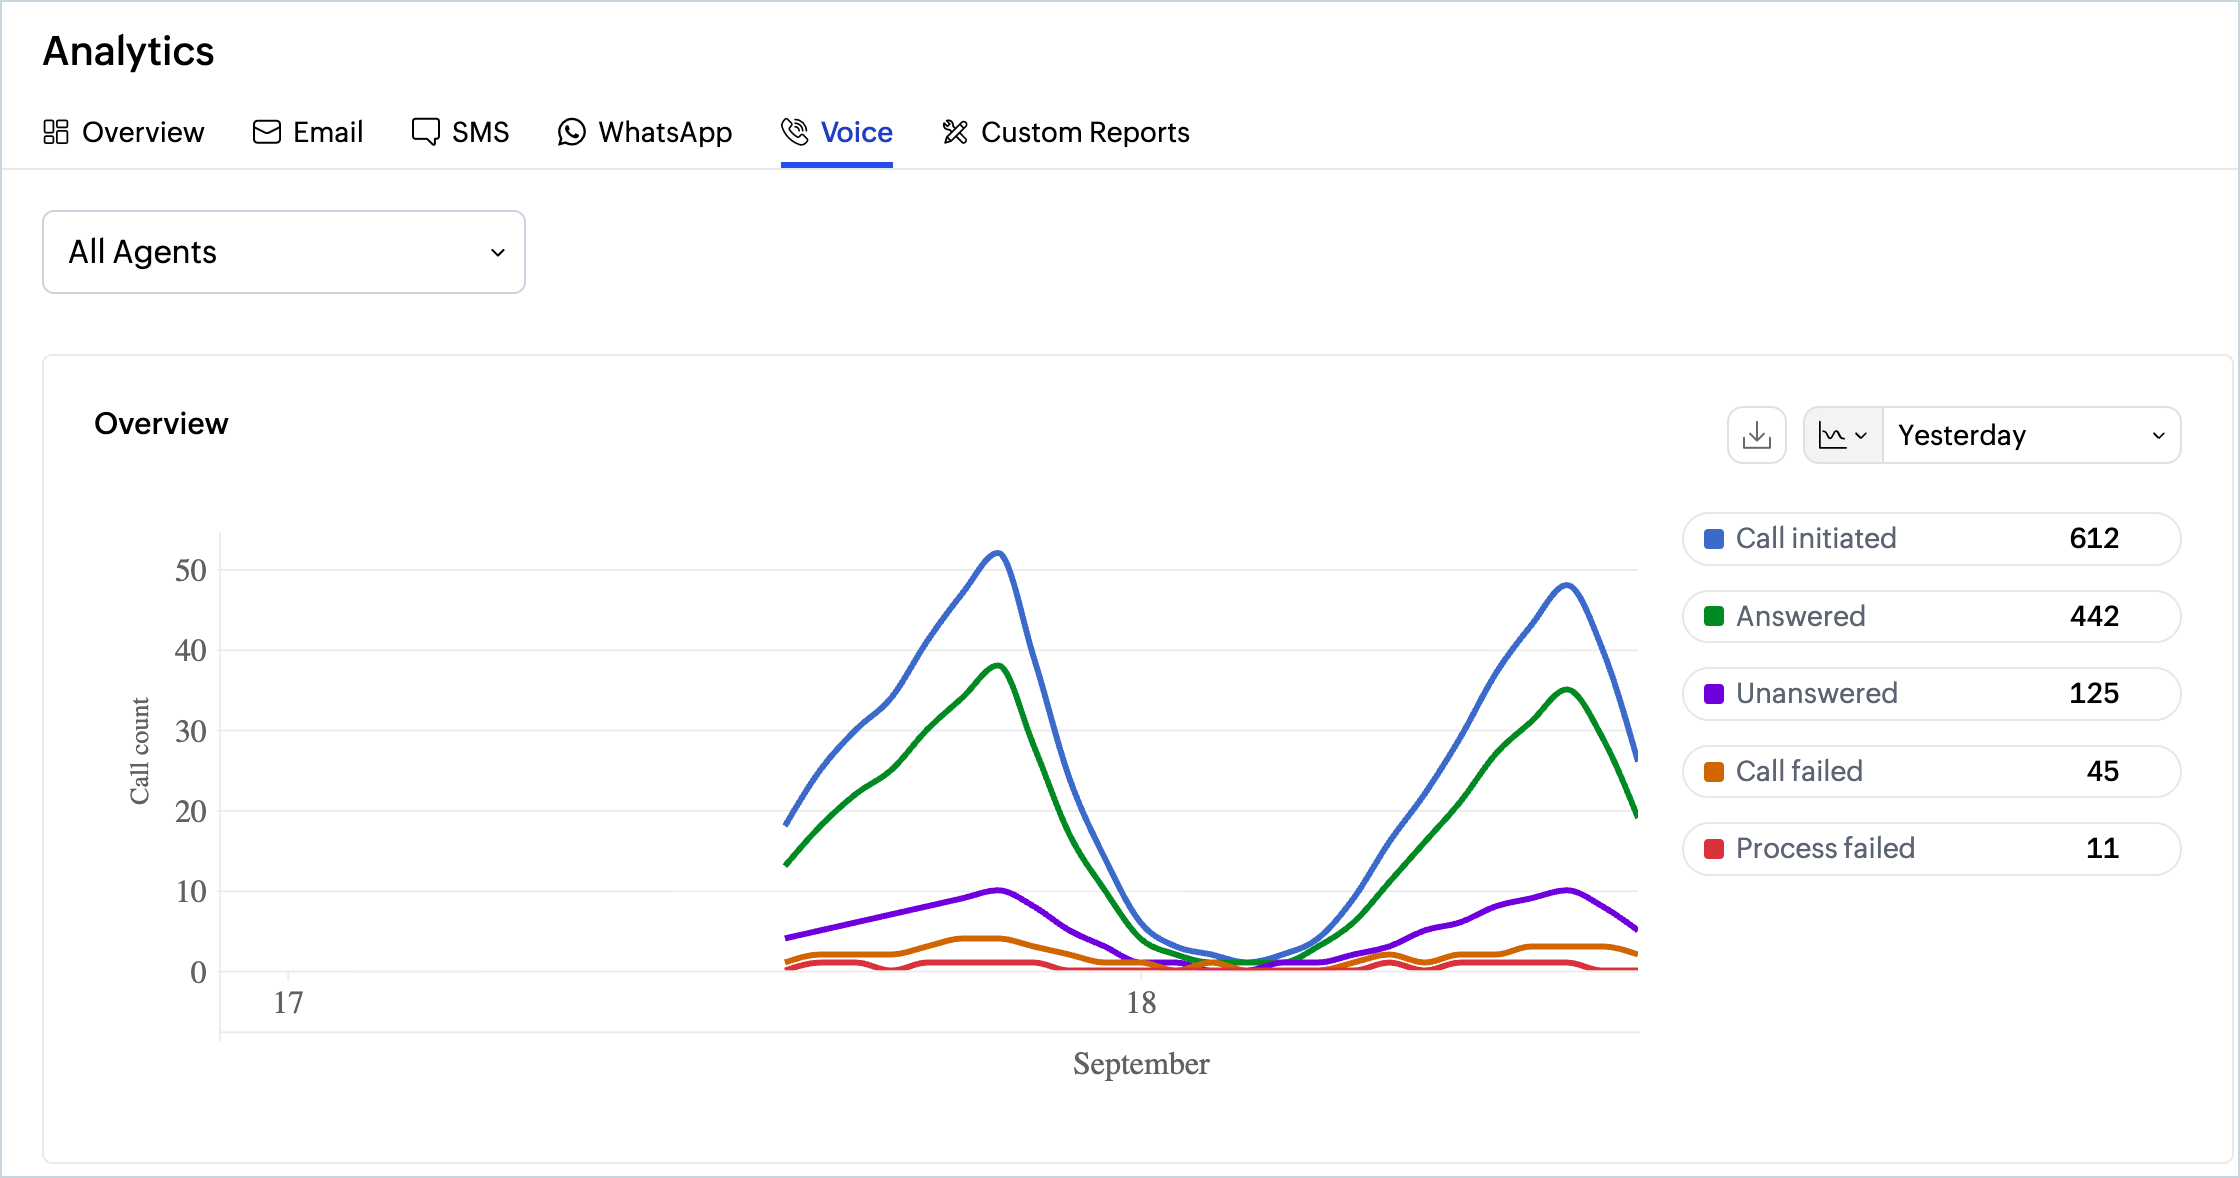
The Voice Analytics dashboard is available under Analytics > Voice. It gives you a full summary of all calls initiated from your account within the selected time range, broken down by their outcome status.
To view Voice calls analytics reports in Zoho CPaaS:
- Log in to your Zoho CPaaS account.
- Go to Analytics tab.
- Click Voice in the top menu.
Overview chart
The overview chart plots the count of calls by status across the selected date range. Each call status is rendered as a separate line in a distinct colour, so you can immediately see how call volumes and outcomes are trending relative to each other.
The chart refreshes automatically when you change the time range. To update the period, click the time range drop-down in the top-right corner and select the desired option. Available options include Last 7 days, Last 15 days, Last 30 days, and custom date ranges.
Call status summary
The status summary panel to the right of the chart shows the total count for each call outcome within the selected period. The following statuses are tracked:
- Call initiated: The total number of outbound calls triggered from your account. This includes all calls regardless of whether they were eventually answered, unanswered, or failed.
- Answered: The number of calls that were successfully connected and answered by the recipient. This is the primary success metric for voice campaigns and automations.
- Unanswered: The number of calls that were initiated and reached the recipient's network but were not answered. This includes calls that rang out, were declined by the recipient, or were diverted to voicemail without being picked up.
- Call failed: The number of calls that could not be connected to the recipient's device. This can occur due to an invalid or unreachable destination number, a busy line, network errors on the recipient's end, or carrier-side rejections.
- Process failed: The number of calls that failed before being placed. This typically indicates issues such as misconfigured caller IDs, invalid destination numbers passed to the API, or account-level restrictions that prevented the call from being initiated.
The Answered, Unanswered, and Call failed counts together should account for all calls that were successfully initiated.
Filter criteria
By default, the dashboard aggregates data across all Agents in your account. To view the performance of a specific Agent, click the All Agents drop-down at the top of the page and select the desired Agent. The overview chart and status summary will update to reflect data for that Agent only.
This is especially useful when you have multiple voice workflows or IVR campaigns running under separate Agents and want to isolate performance metrics for each.
Chart and download options
The overview chart can be viewed in two modes, toggled from the top-right corner of the chart panel:
- Line chart: Plots each call status as a continuous line over time. This view is ideal for spotting patterns, spikes, or drop-offs in call activity and outcomes across the selected period.
- Bar chart: Displays the message count for each status as verticals bars plotted on the date axis.
- Tabular format: Shows the exact call counts for each status, broken down by date. Use this view when you need to reference precise numbers for a specific day.
You can export the data shown in the chart for record-keeping or further analysis. To download:
- Select the desired chart-view option from the top-right corner of the chart.
- Click the download icon and choose the preferred format.
The supported download formats are JPEG, PNG, SVG, CSV, and PDF.