Reports
Reports help teams make more informed decisions. With velocity charts, burnup and burndown charts, and cumulative flow diagrams, Zoho Sprints allows agile teams to see what went well and how to improve for the next sprint.
SIGN UP FOR FREE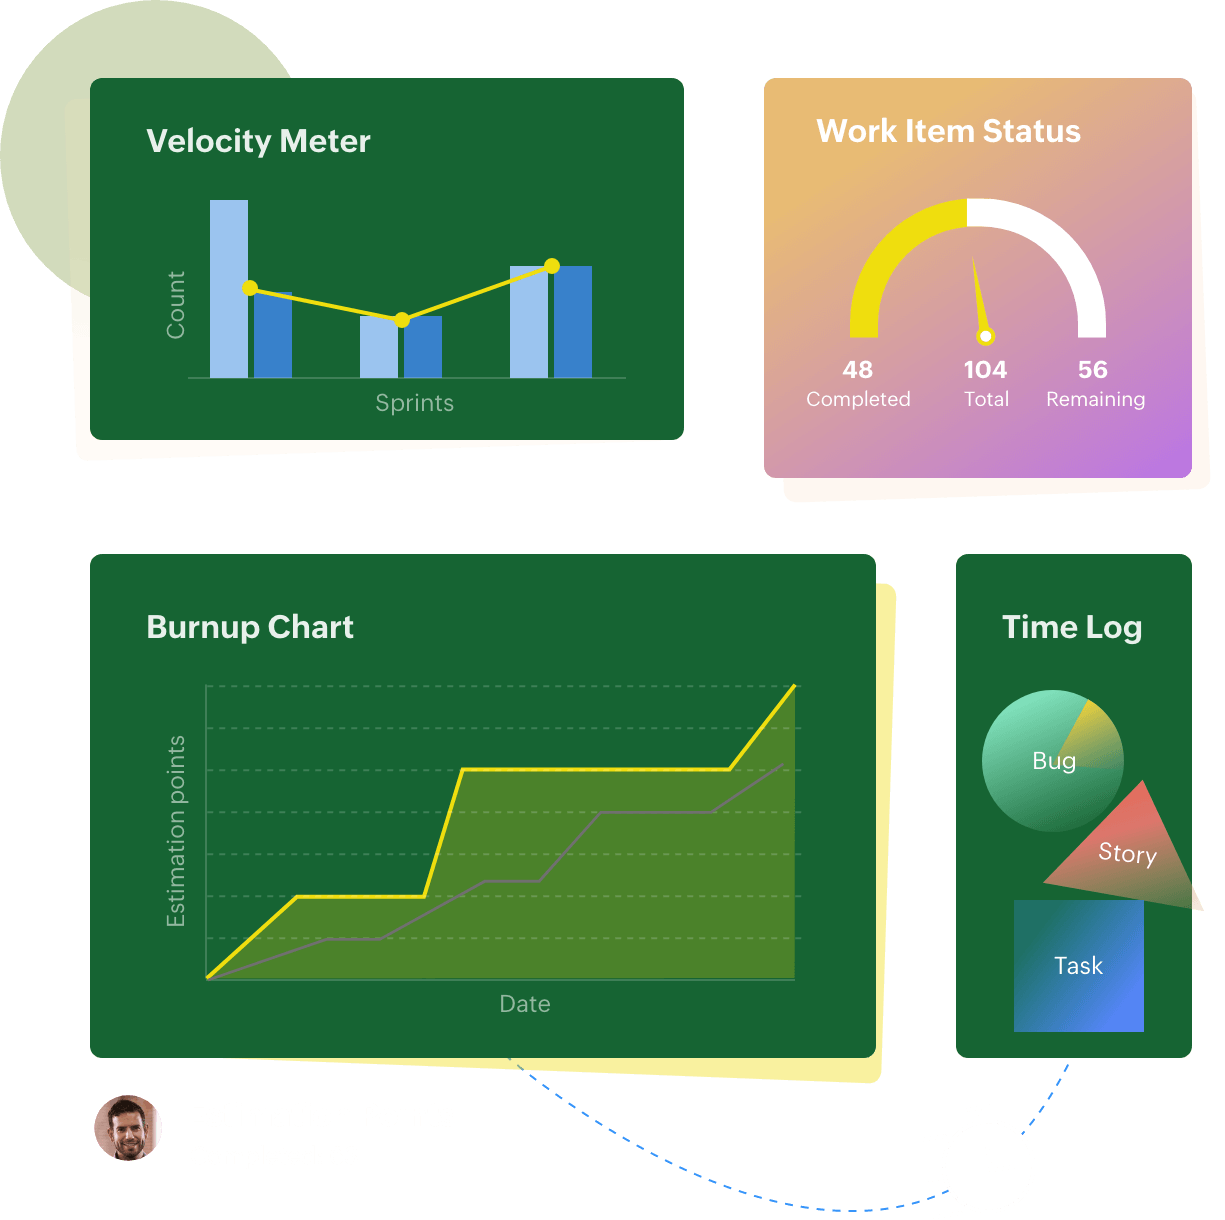
- Functionality and clarity through reports
- Personalized agile metric dashboard for every user
- Easy visualization of data
- Effective sprint planning
Generate relevant reports and put them to use
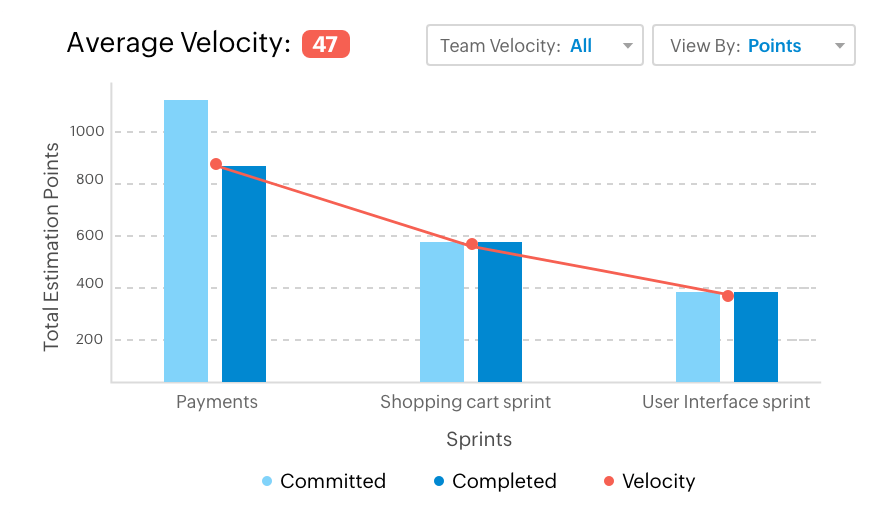
Velocity chart
Estimate future sprints better with the Velocity chart, which compares commited and completed estimation points. This gives you the rate at which your team is delivering business value, helping you predict your progress.
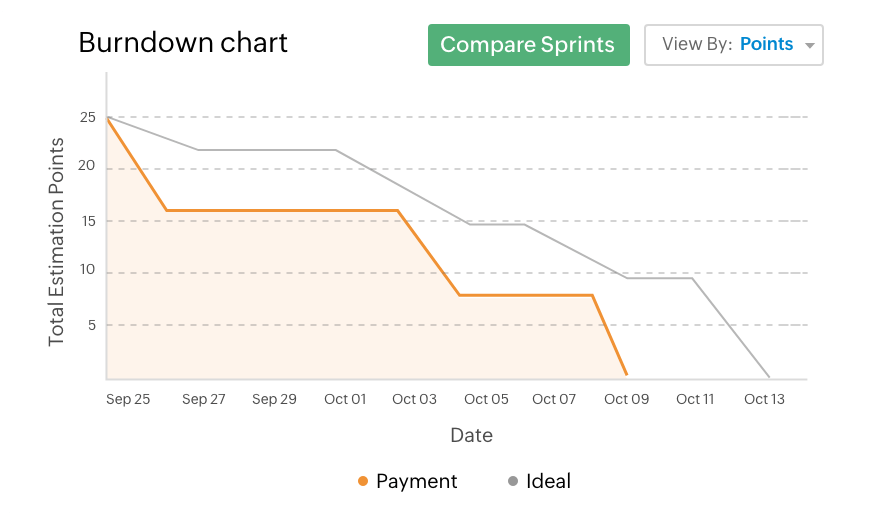
Burndown and Burnup Charts
See the pace at which your team is burning through user stories by comparing the current progress line to the ideal progress line. You can compare up to five sprints to see how far you have come.
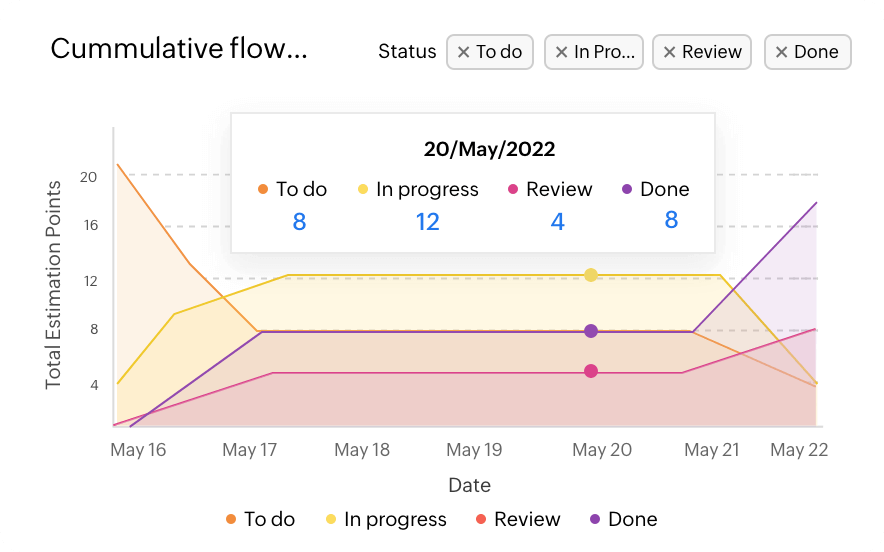
Cumulative Flow Diagram
Identify bottlenecks, see the changes to your work in progress, and track the scope of your sprint. Keep a track of how many work items are in each status, to make sure you add resources where it is most efficient.
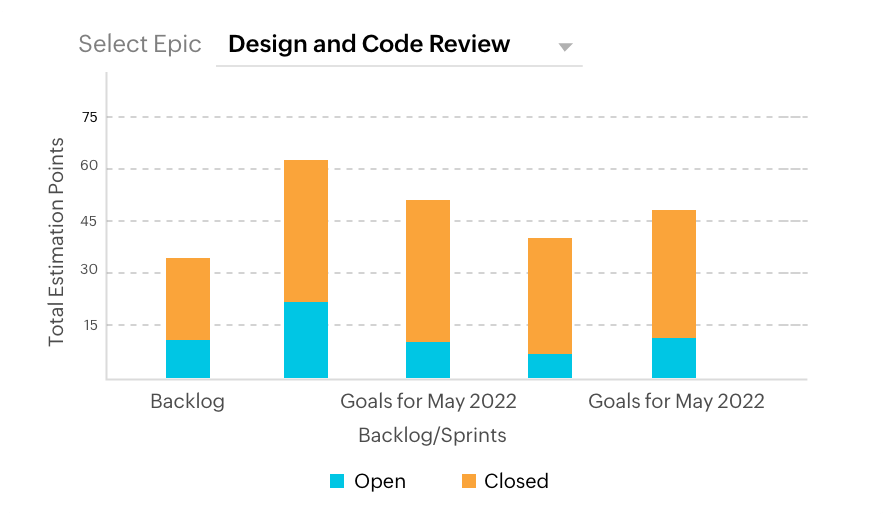
Epic Progress Chart
Monitor the sprint-wise progress of each epic, along with a detailed summary of the work items and their status.
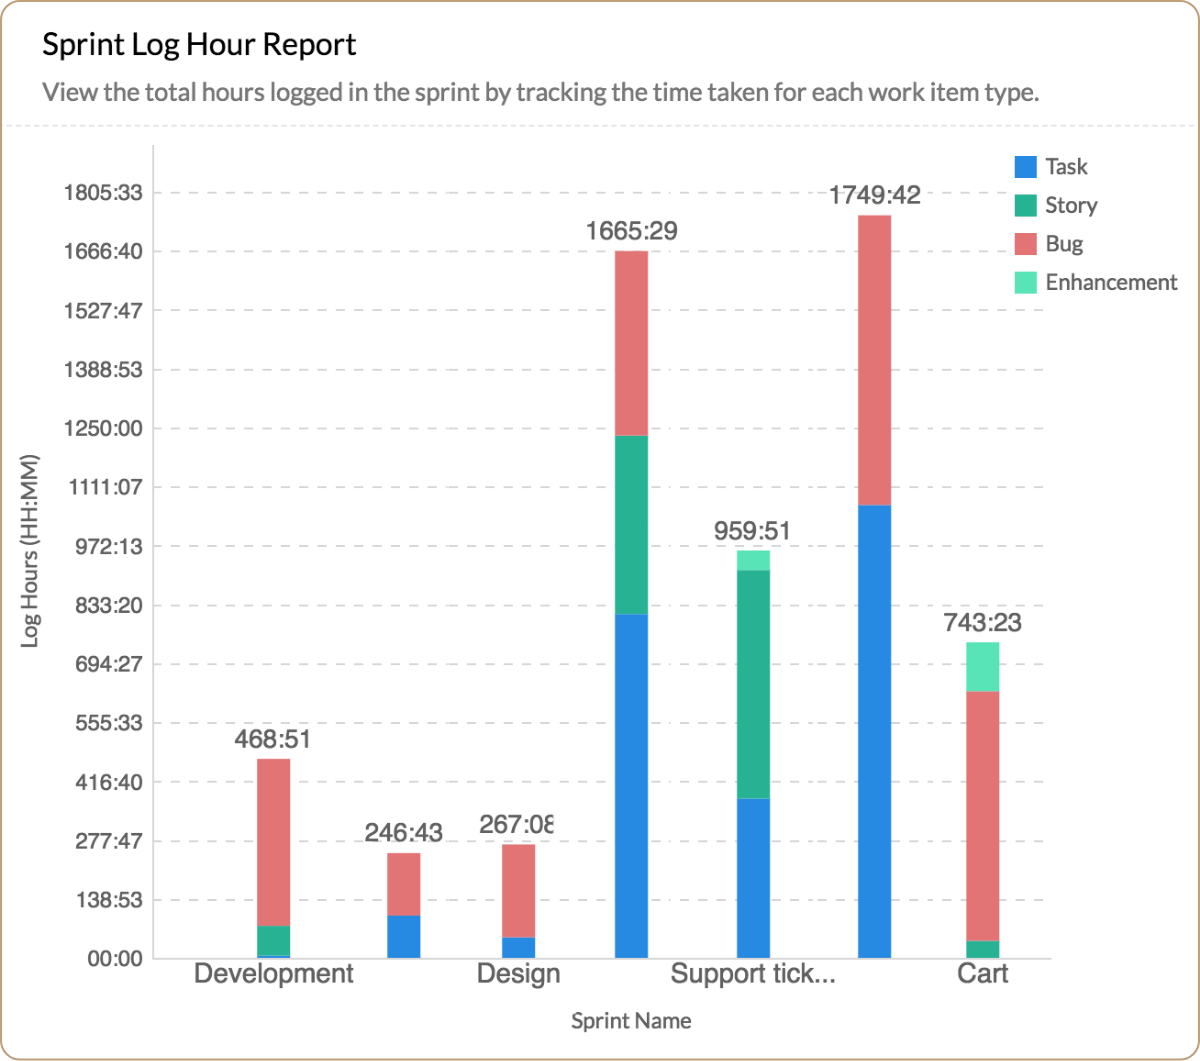
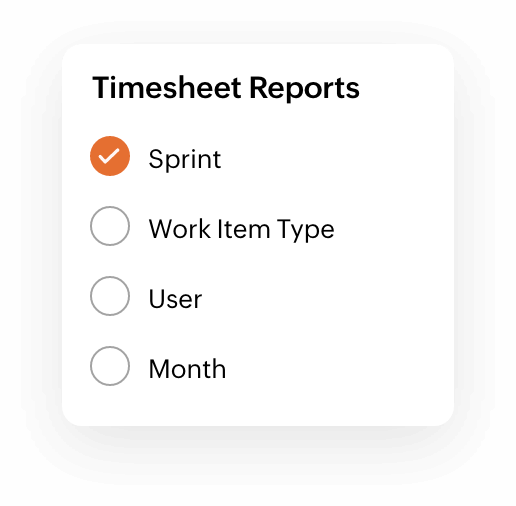
Timesheet Reports
Get reports for your timesheets and know your log hours distributed across, sprint, work item type, user and month.
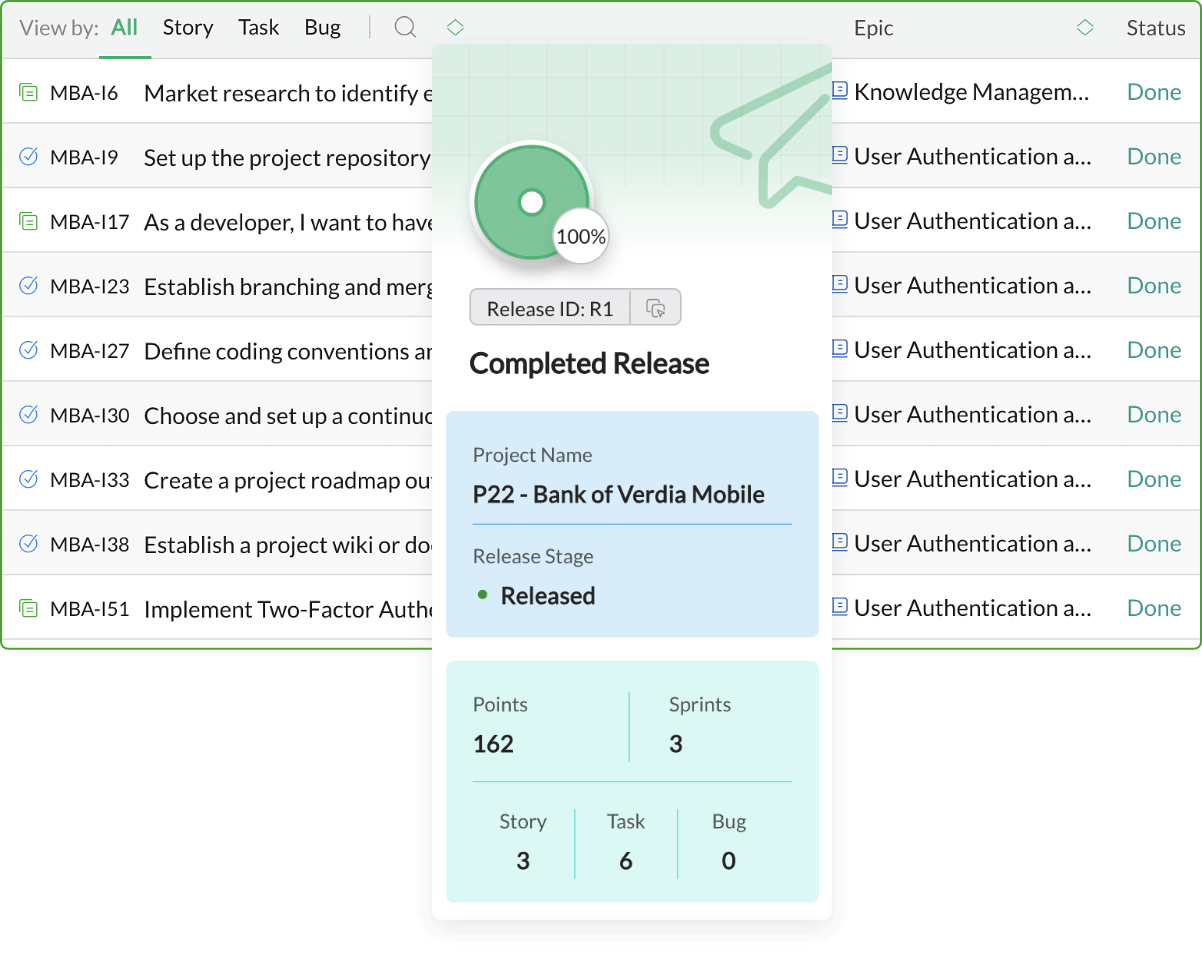
Release Notes
Use the release notes for completed and canceled sprints to analyze the team resources that went into each release.
Global View
Get a cross-project view of all your work items through different views. Use filters to get the most relevant data and the most effective views.
User Profile
Get a personal dashboard for each user and analyze their contribution and to know the areas for improvement.