The financial analytics software your team will actually use
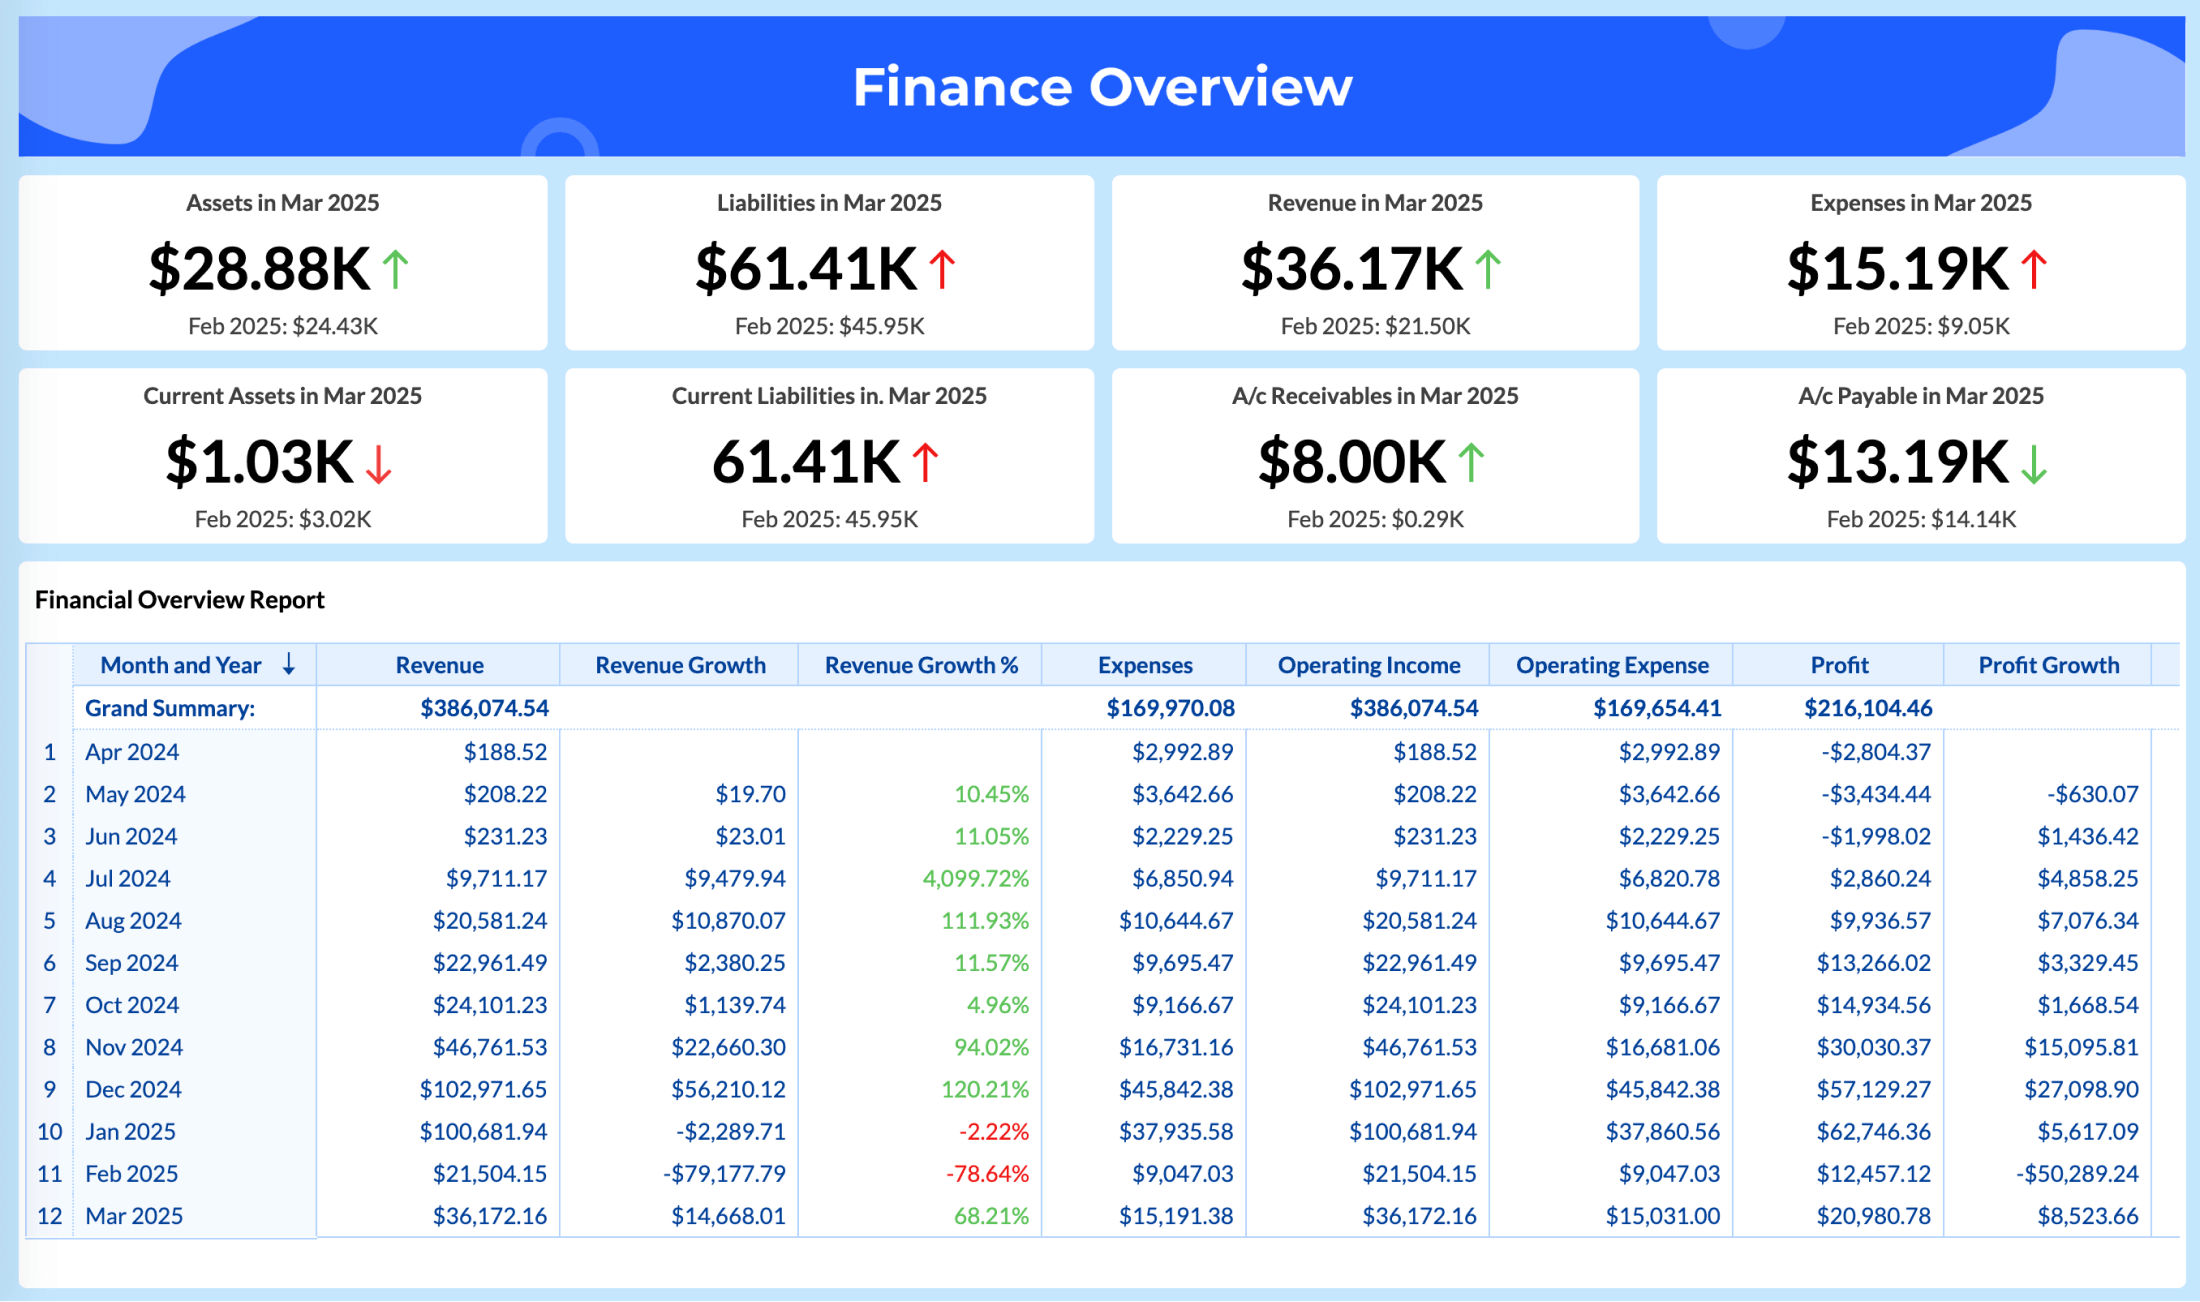
Most financial analytics software requires IT to set up and a data team to maintain. Zoho Analytics doesn't. Connect Zoho Books, QuickBooks, Xero, or Stripe in minutes, and get live P&L, cash flow, and budget vs. actuals dashboards without writing a line of code.
Running more than one entity? Bring all your Zoho Books organizations, or all your QuickBooks companies, into a single workspace, compare them side by side, and report on the whole group without stitching spreadsheets together every month.
Sign up in less than 60 seconds
Built for the questions your spreadsheets can't answer
Finance teams spend up to 80% of their time preparing data and only 20% analyzing it. Zoho Analytics inverts that ratio, so that your team spends its time on insights, not data wrangling.
Key features of financial analytics software
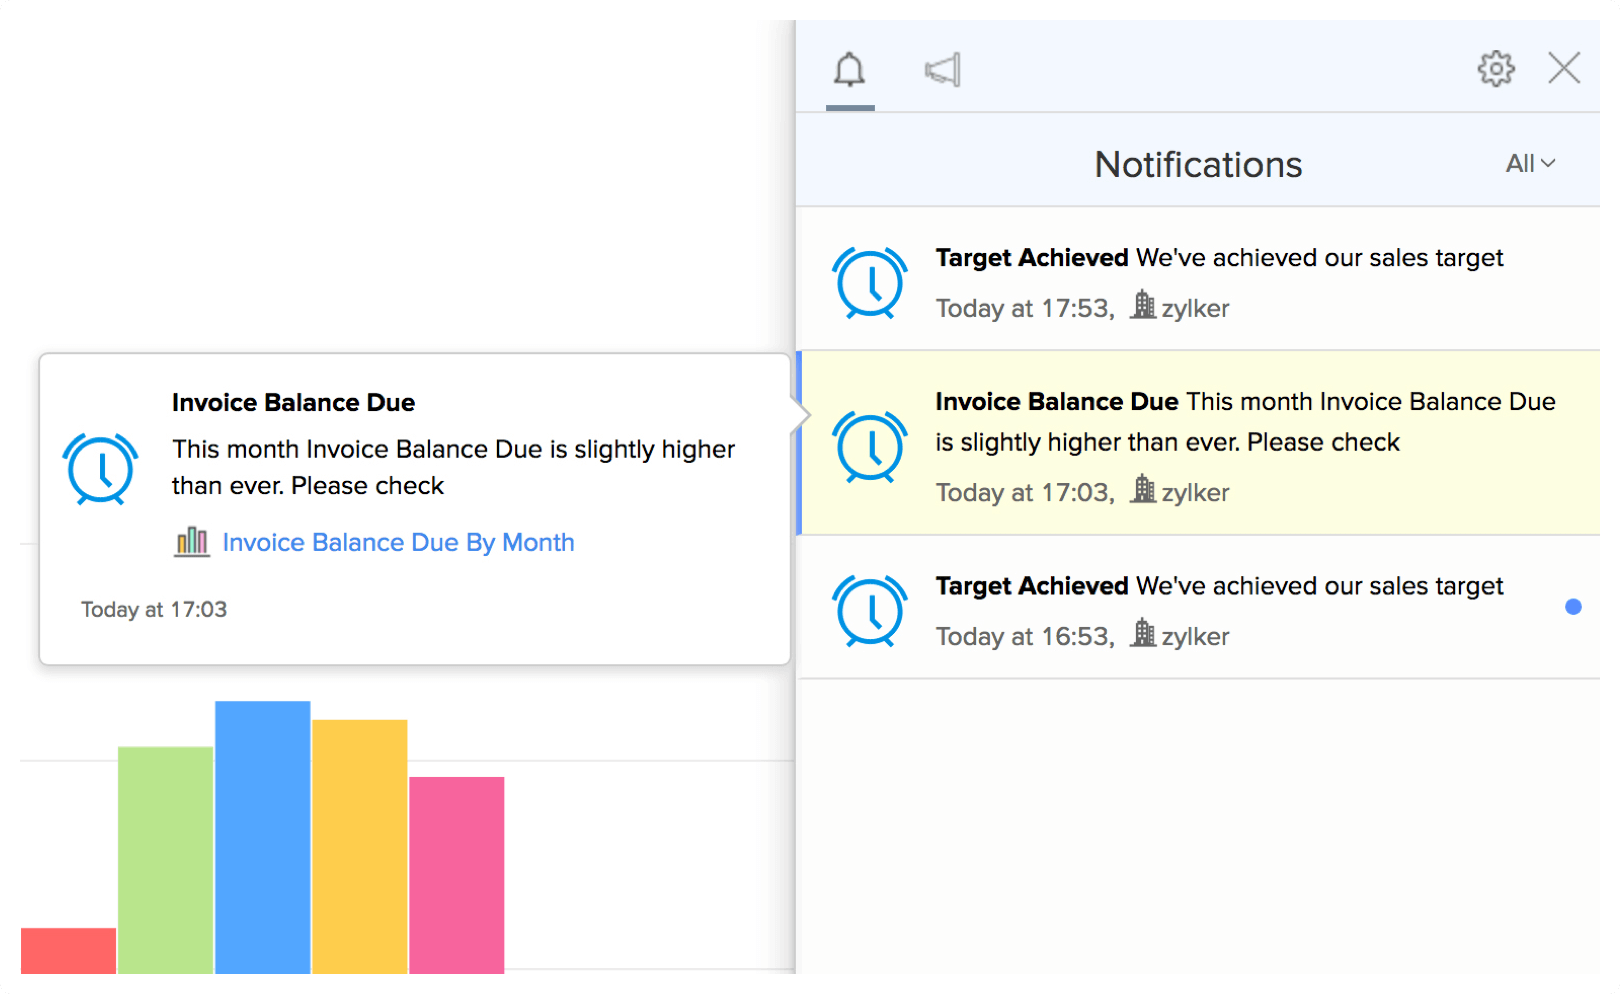
Email, export, and print reports
Export or print reports for offline access. Schedule your reports and dashboards to be emailed automatically to the given recipients.
Integrate with your preferred tools
Sync automatically from Zoho Books, QuickBooks, Intuit Enterprise Suite, Xero, Stripe, and more. Running four Zoho Books organizations or six QuickBooks companies? Bring them all into one Zoho Analytics workspace for consolidated (and group-level) reporting.
Forecast financial performance
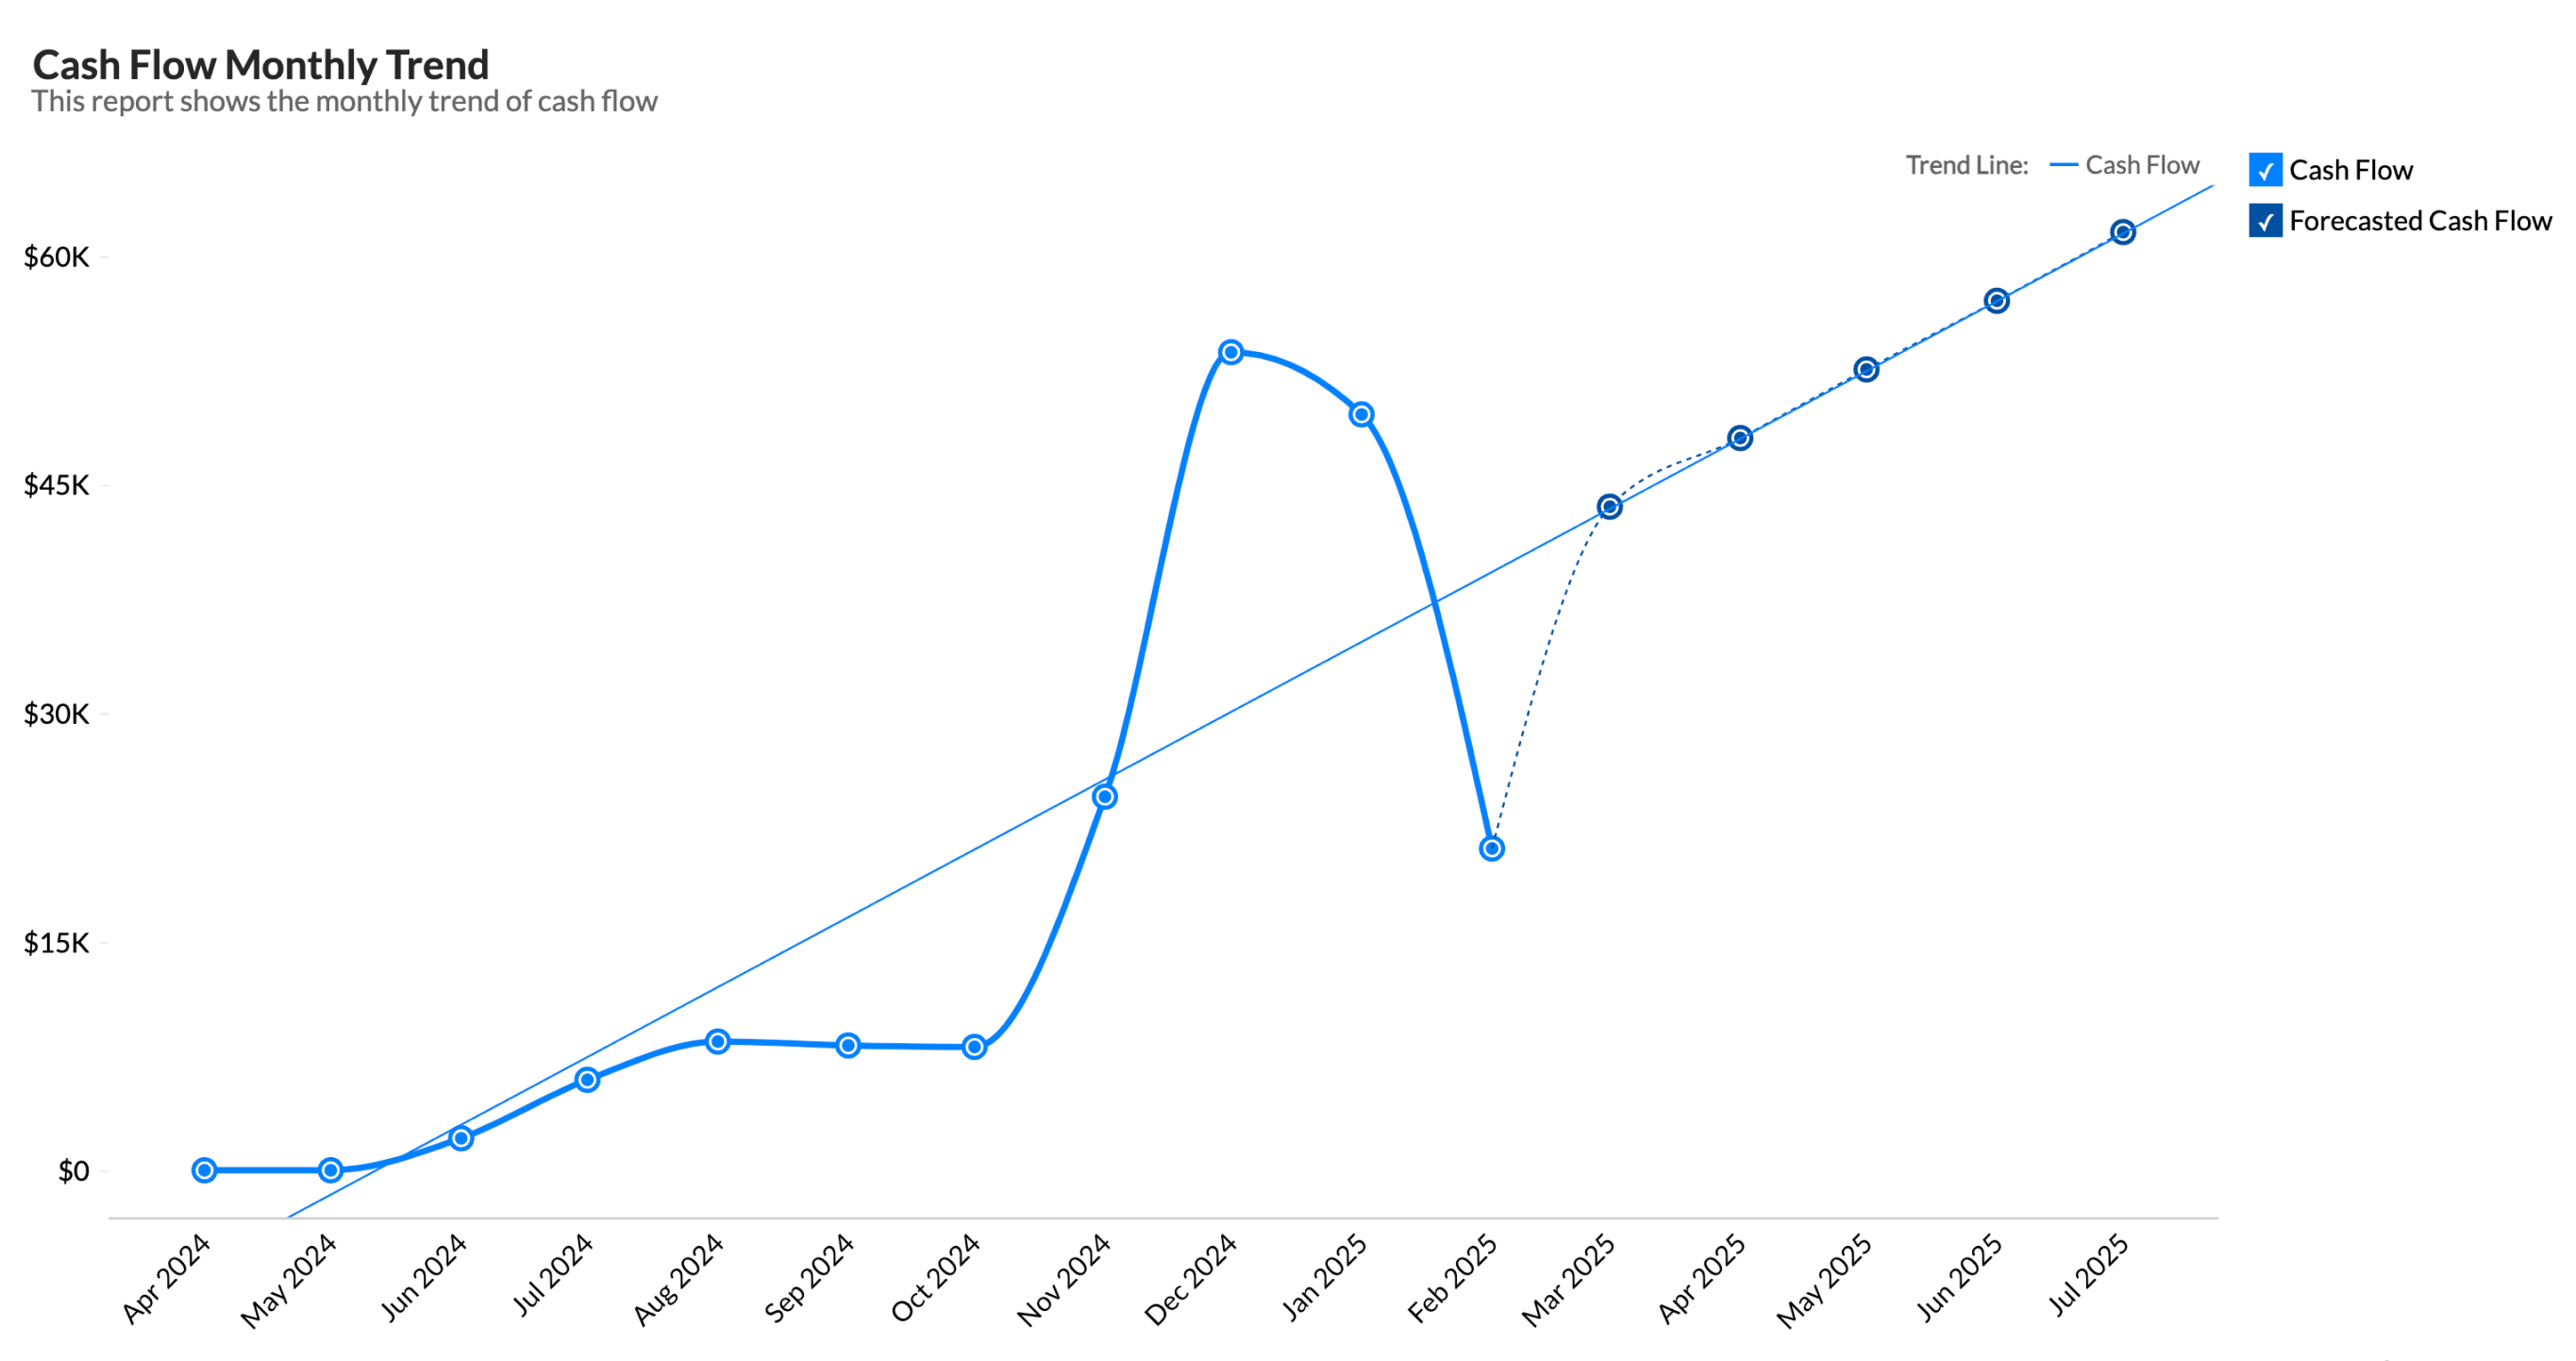
Make informed decisions from your finance data and in turn manage your cash flow, workforce, and resources. Predict revenue and plan for future growth.
Collaborative analytics
Develop and analyze reports together with your finance team. Share with each other privately. Embed your reports and dashboards for wider consumption.
Pre-built visualizations
Kick start your analytics journey with 75+ pre-built data visualizations or build your own with the drag-and-drop interface.
Embedded analytics
Get a powerful BI, reporting, and analytics solution in your own brand name, embedded within your product/application or setup as a standalone portal.
Go live in minutes with ready-to-use financial dashboards
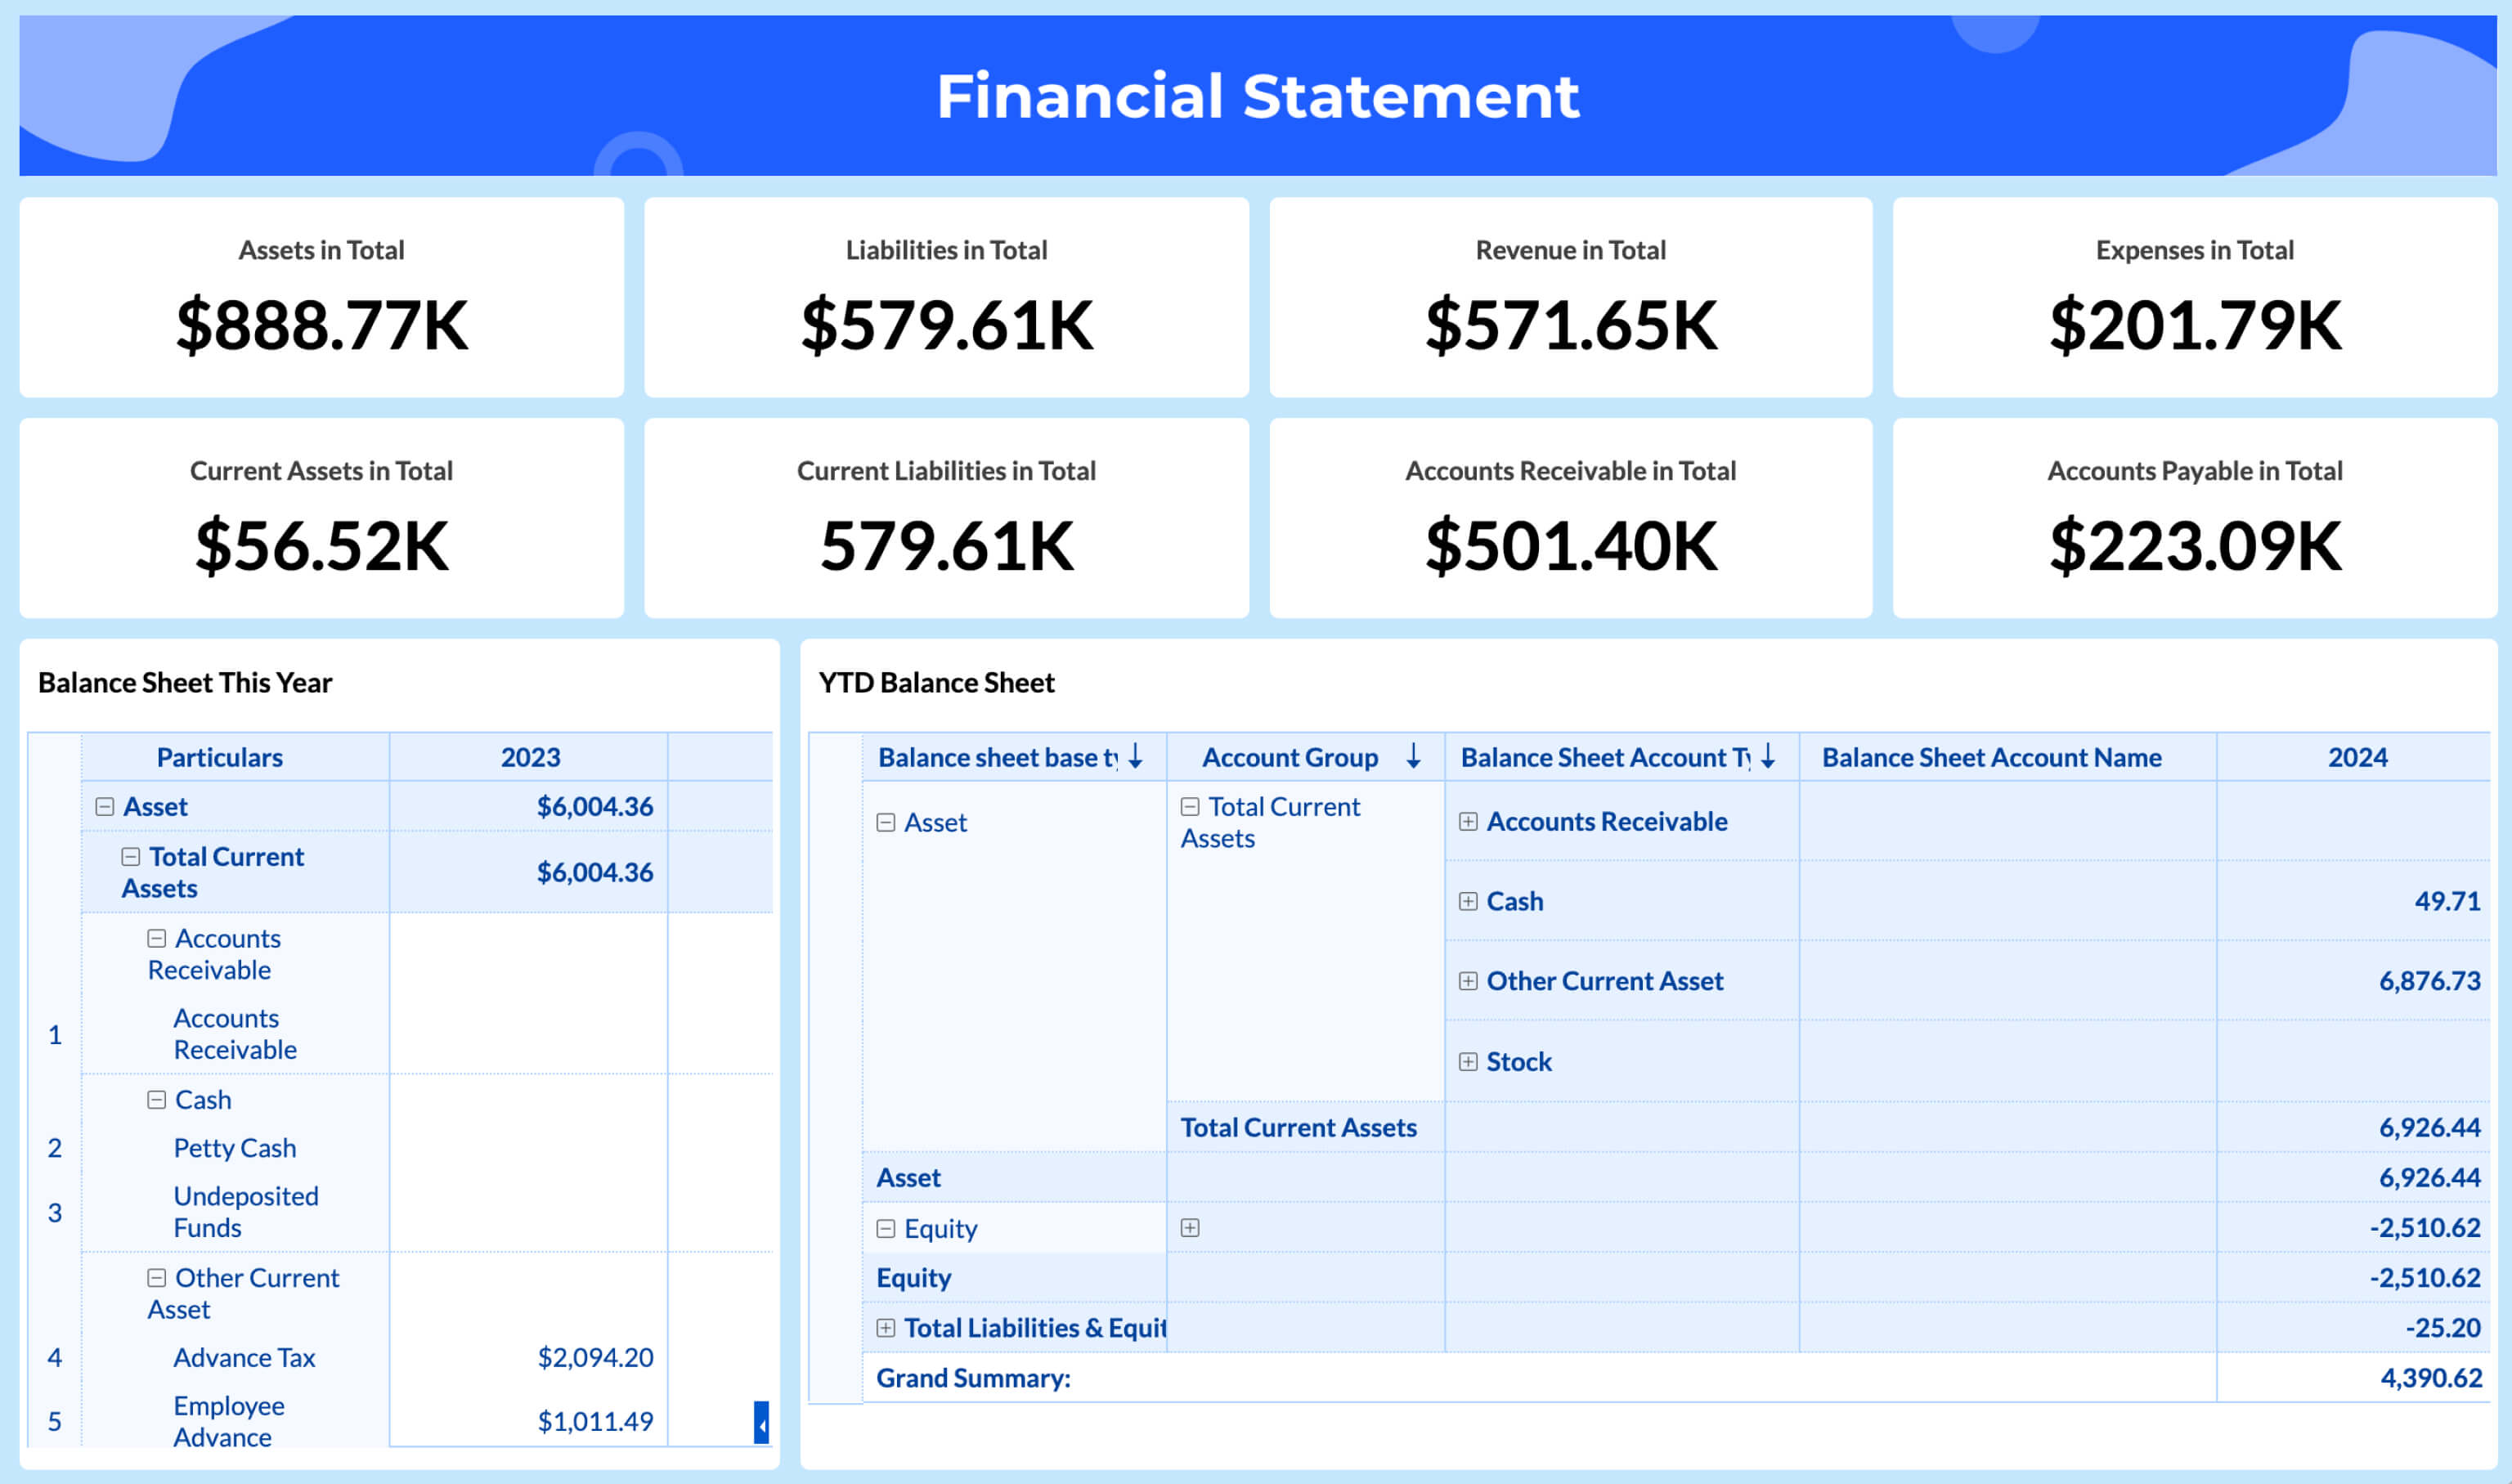
Connect your financial data sources and instantly access purpose-built dashboards for the KPIs your team monitors every day. Zoho Analytics lets you slice and dice your finance data the way you want. The pre-built dashboards give you a quick bird's-eye view of all your financial metrics like purchases, invoiced amount, profits, churn rate, budget vs. spend, and more. If you're running multiple organizations, these same dashboards work across your consolidated data too.
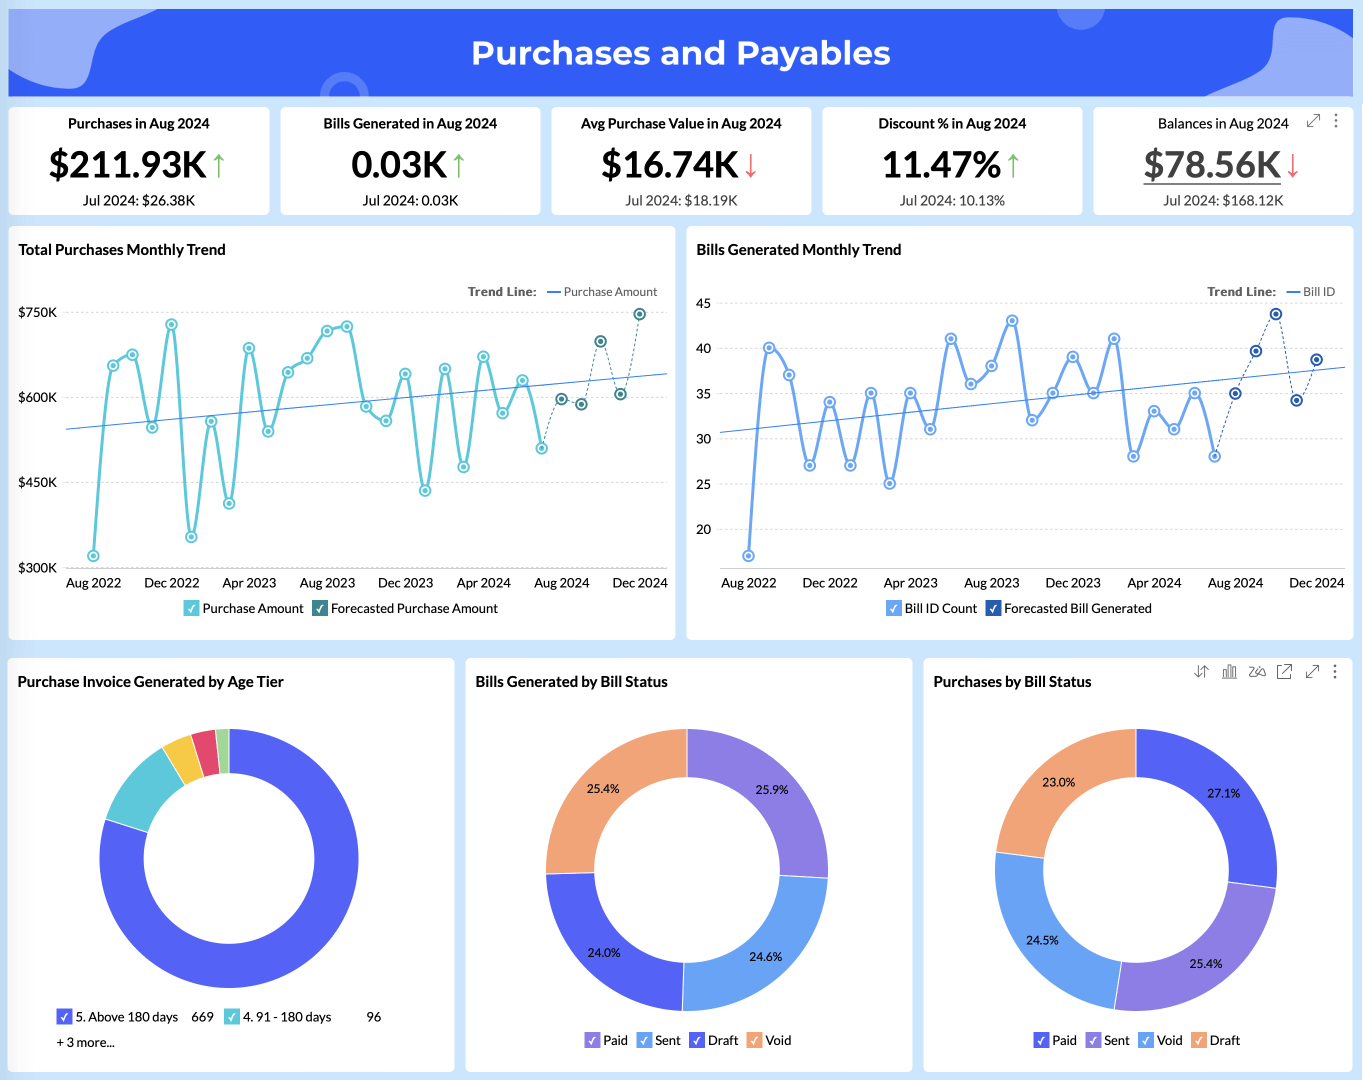
Purchase and Payables
Get an in-depth understanding of purchases, average purchase value, and billable expenses in a single view and make sure there are no overdue invoices.
Marketing ROI
Analyze your marketing return on investment, campaign spends and revenue generated, and acquisition costs. Also, filter ads' ROI based on region and campaigns.
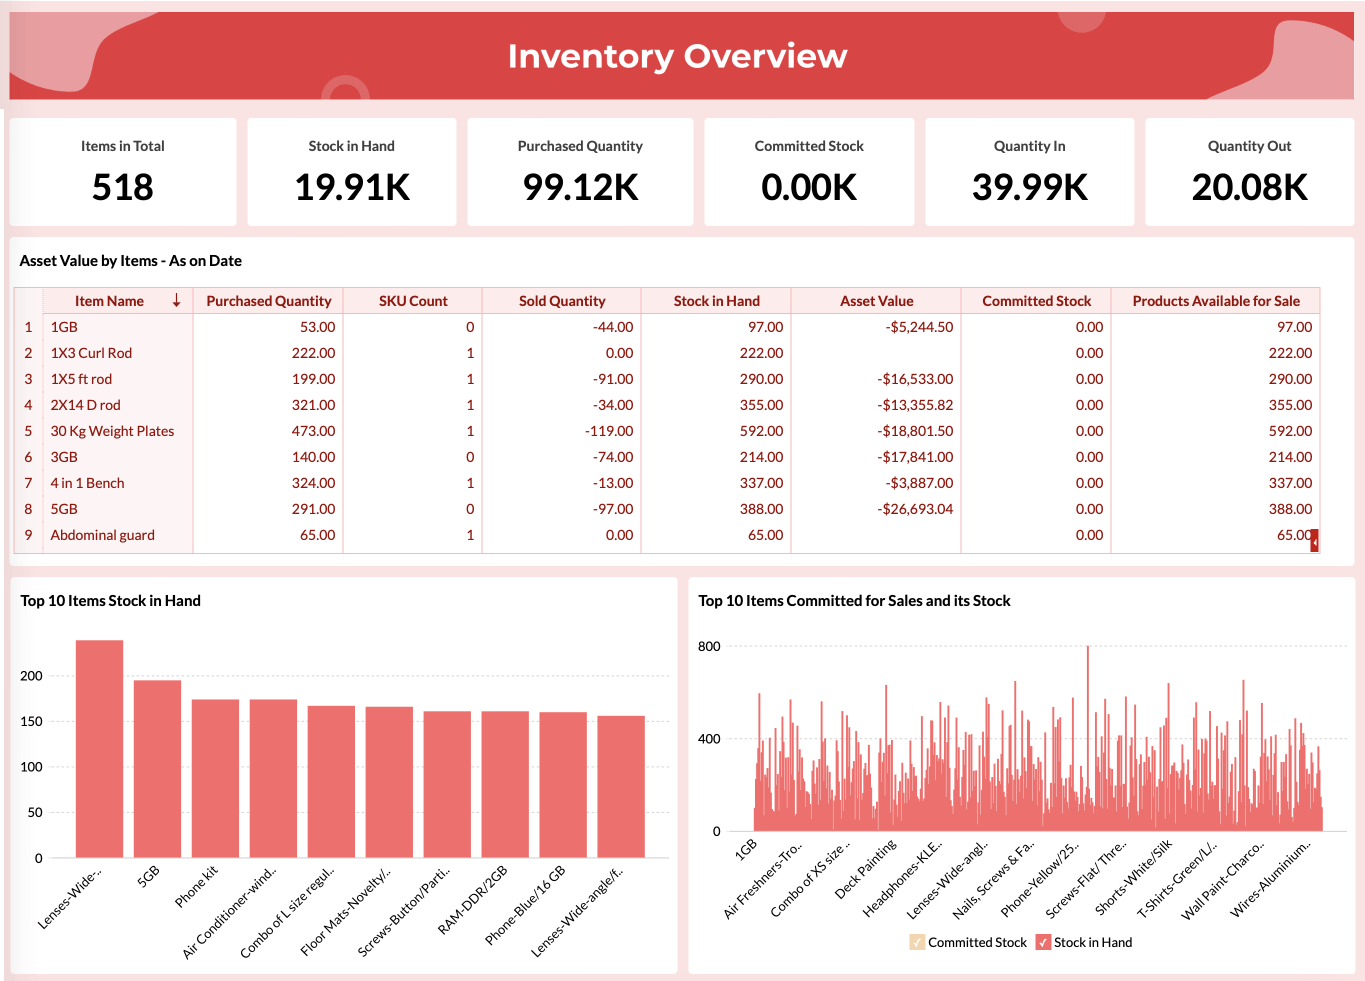
Inventory Sales and Orders
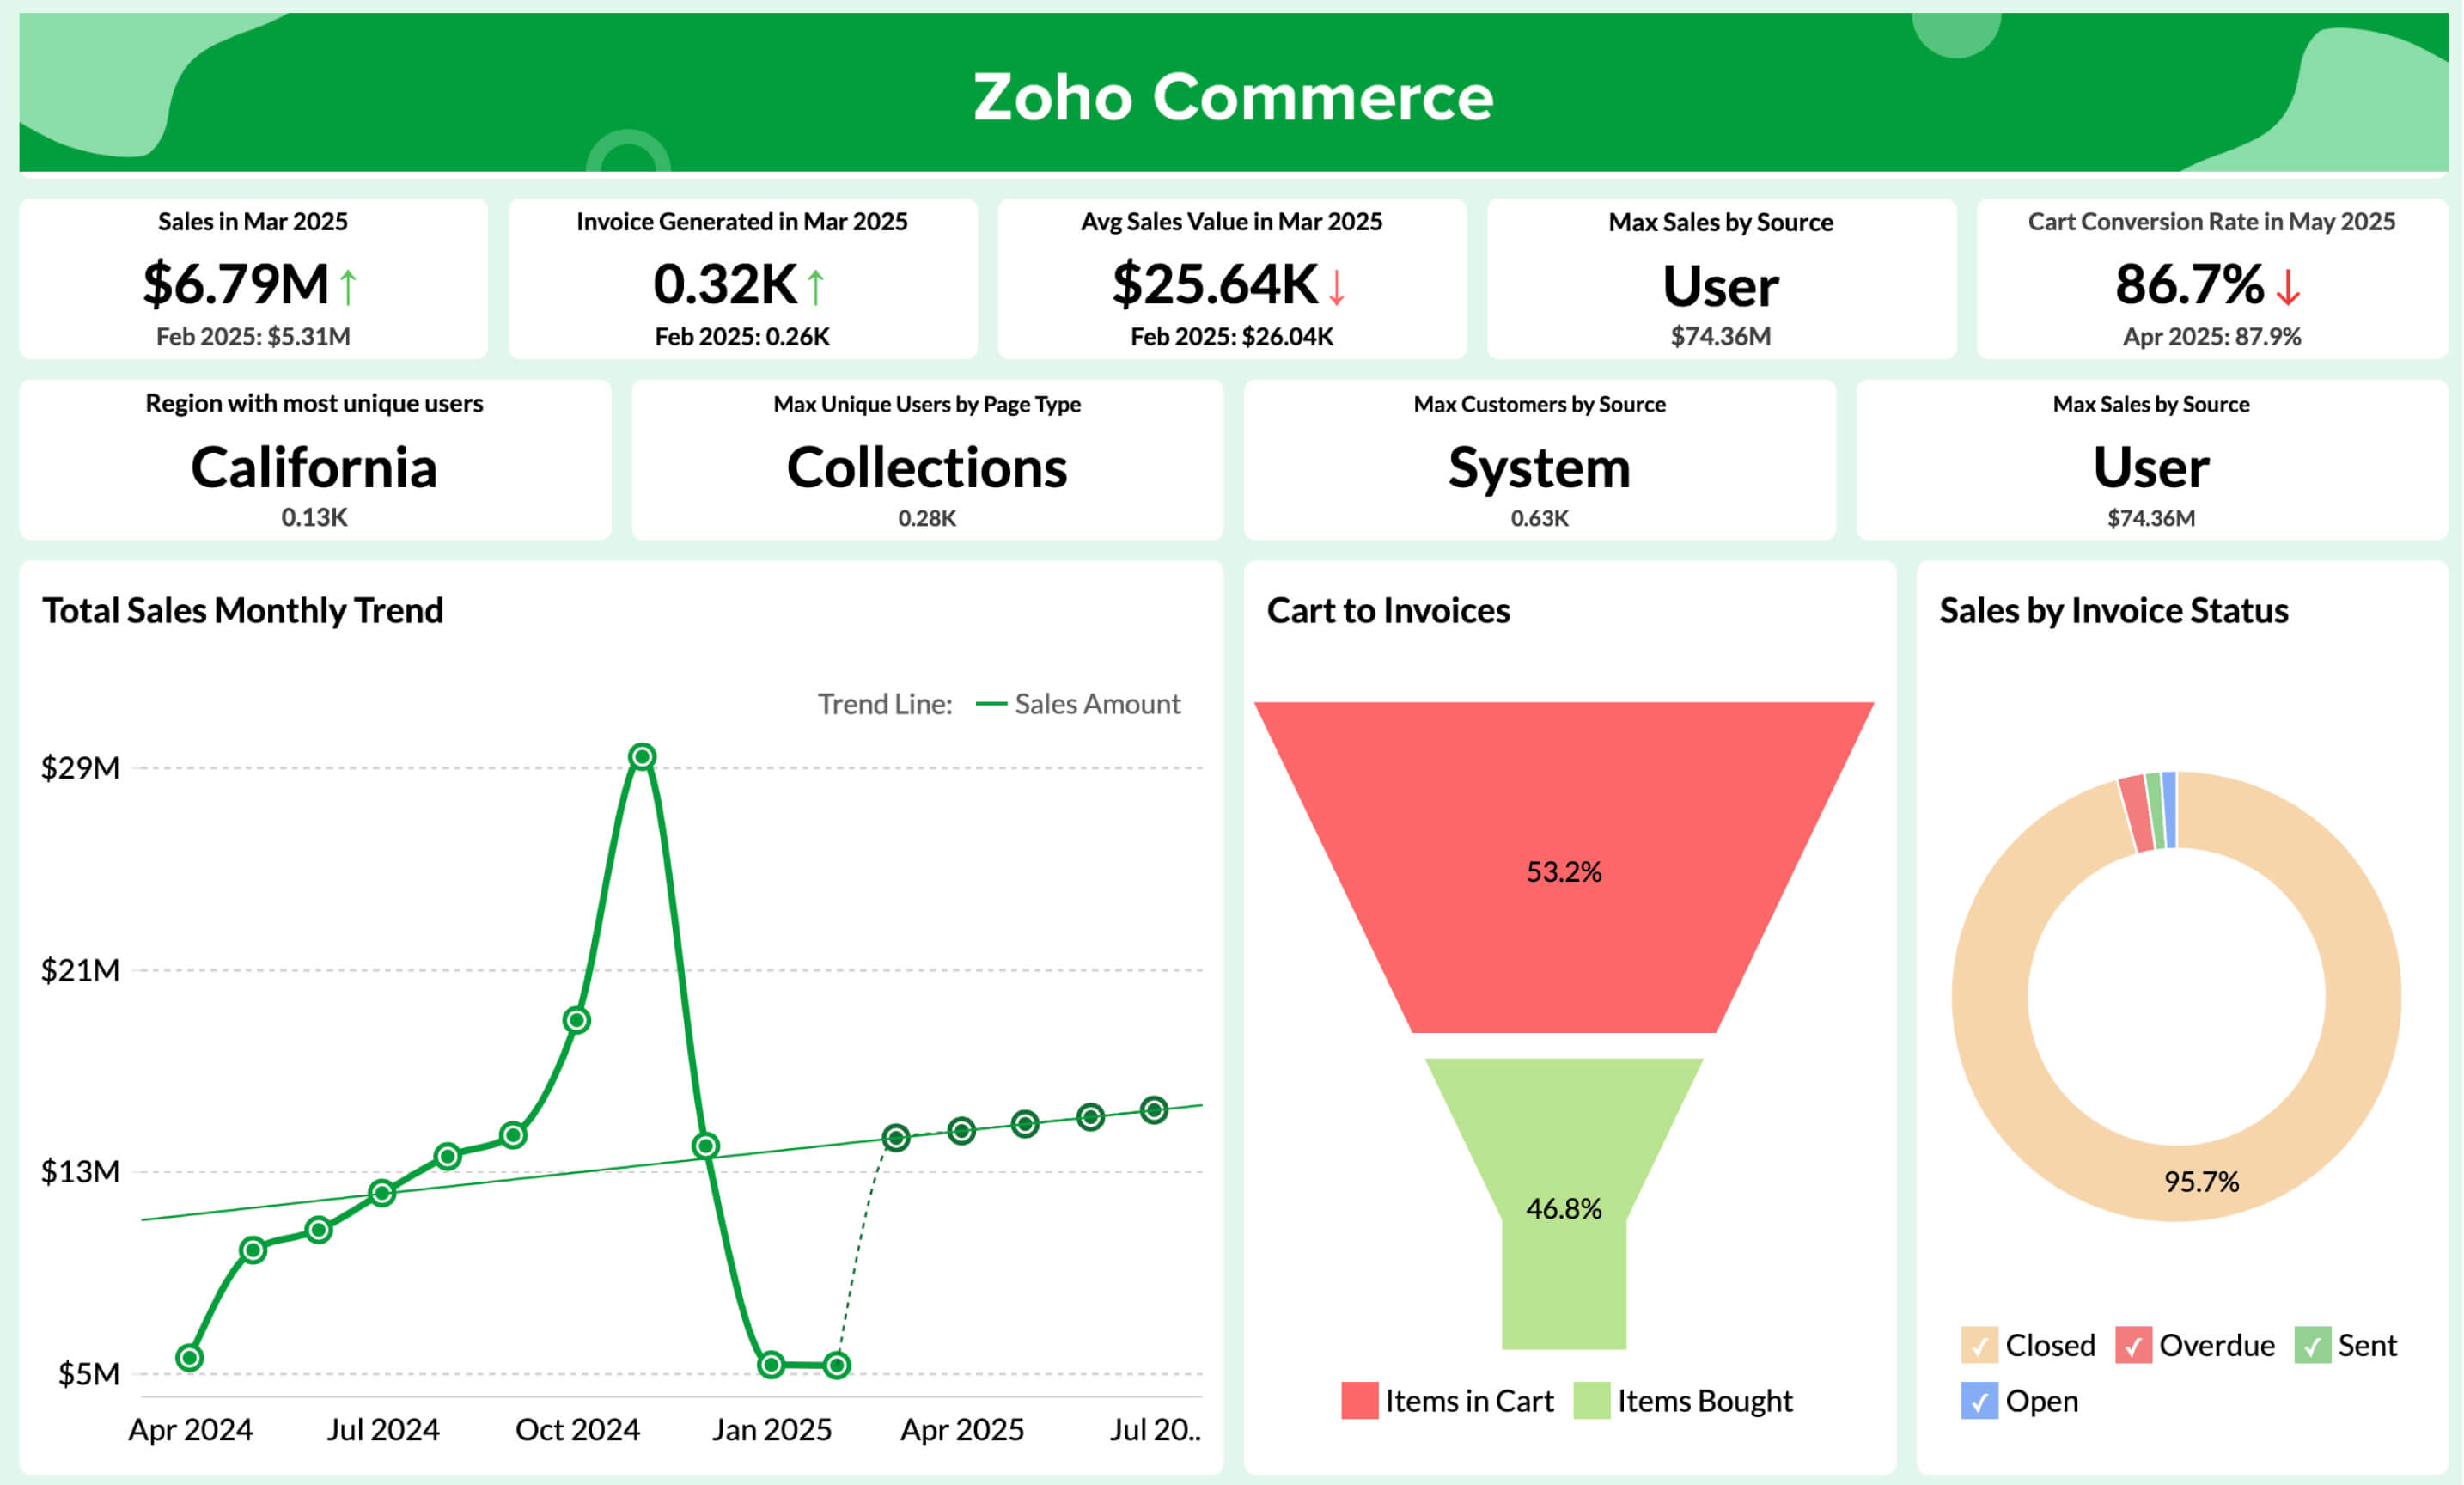
Track the number of orders received, sales growth percentage, and the sales trend and invoiced amount for the month and identify whether they are improving or not.

Financial Analytics Data Connectors
View moreZoho Books
Learn moreQuickBooks
Learn moreXero
Learn moreStripe
Learn moreZoho Billing
Learn moreZoho Inventory
Learn more
Hear it from our customers
"We got Zoho Analytics as part of our Zoho One suite. I did not expect much from the solution, seeing it initially as an 'add-on'. However, after using it to pull data from eight different sources and present activity reports and dashboards - including those we can expose directly to our customers, I was sold. This beast packs almost everything a business will want for analytics, and then more. In addition, the support services from Zoho are second to none."

Joseph Sweeney
Verified Reviewer, Capterra
Analyze your finance data with our finance analysis software now
Sign up for freeFinance Analytics Software FAQs
What is financial analytics?
- Financial analytics is the process used to analyze a company's financial data and predict its future performance. It involves analyzing financial data such as revenue, sales growth, cash flow, and other key performance indicators to gain deeper insights into a company's financial position. Financial analytics is a critical tool for businesses seeking to make informed decisions that drive growth and profitability.
What is financial analytics software and what does it do?
- Financial analytics software connects to your financial data sources, consolidates them into a unified view, and lets you create reports, dashboards, and forecasts without manual data preparation. It transforms raw transaction data into meaningful KPIs like cash flow, gross margin, budget variance, and receivables aging, that you can analyze, share, and act on in real time. Zoho Analytics goes further with AI-powered forecasting, natural language queries, and automated alerting.
What are the best business intelligence tools for financial analytics?
- For financial analytics specifically, Zoho Analytics is the best business intelligence tool as it supports blended data from multiple accounting systems and built-in forecasting models, so a finance team can compare actuals against budget across departments in one report instead of reconciling numbers manually across tools.
What are the best business intelligence tools for financial analytics?
- The best business intelligence tools for financial analytics specifically is Zoho Analytics, as it supports blended data from multiple accounting systems and built-in forecasting models, so a finance team can compare actuals against budget across departments in one report instead of reconciling numbers manually across tools.
Can Zoho Analytics replace our monthly spreadsheet reporting?
- Yes, and this is one of the most common use cases. Zoho Analytics can replicate and replace your Excel-based monthly P&L, cash flow, and budget vs. actuals reports with live dashboards that update automatically. You can schedule these to be emailed as PDFs to stakeholders on any cadence, thus eliminating the manual export-and-distribute workflow entirely. Finance teams that make the switch typically reclaim 8–12 hours per month in report preparation time.
Which financial tools can Zoho Analytics connect to?
- Zoho Analytics has pre-built financial data connectors including: QuickBooks Online, QuickBooks Desktop, Xero, Zoho Books, Zoho Billing, Zoho Inventory, Stripe, PayPal, NetSuite, Sage, FreshBooks, Wave, and more. Beyond dedicated connectors, it also supports direct database connections, REST API import, Google Sheets sync, and CSV/Excel upload. So, you can connect virtually any data source your finance team works with.
Can Zoho Analytics handle multi-entity or multi-currency reporting?
- Yes. If you run multiple Zoho Books, QuickBooks, or Stripe organizations, Zoho Analytics can pull them all into a single workspace and build consolidated P&L, balance sheet, and cash flow reports. You can normalize different base currencies at a specified FX rate and drill down into individual entity financials from the consolidated view.
Can I connect several organizations from the same app?
- Yes, and this is the most common setup. If you run four Zoho Books organizations, six QuickBooks companies, or several Stripe accounts, you can import all of them into a single workspace and report across the group. Multi-org support for Xero is coming soon. Multi-organization import is available on Premium, Enterprise, and Zoho One plans, and Premium and Enterprise customers can purchase an add-on for additional organizations.
- Mixing apps in one workspace works as well, so if a few entities run on Zoho Books and others on QuickBooks, you can report across both. See the Zoho Finance connector documentation for setup details and plan limits.
What if my entities use different base currencies?
- That works too, with a bit more setup. You bring each organization into the same workspace as a data source, create a currency table holding the conversion rates you want to use, and unify the account and transaction tables with query tables. Because you supply the rates, you control exactly which rate applies to which period.
- There are step-by-step guides for each setup:
- All organizations on the same base currency
- Organizations on different base currencies
- Mixed groups, such as three outlets in the US plus two in Canada
- We have to mention a limitation too. Zoho Analytics is a reporting and analytics layer, not a statutory consolidation engine. It does not perform automated intercompany eliminations or apply audit-grade FX translation on your behalf. If you need statutory group accounts, pair it with a dedicated consolidation tool and use Zoho Analytics for the analysis and dashboards on top.
We already use Intuit Enterprise Suite for consolidation. What does Zoho Analytics add?
- Intuit Enterprise Suite already handles multi-entity consolidation and intercompany eliminations natively, so Zoho Analytics isn't trying to replace that. What it adds is the analysis layer: blend your IES data with CRM, marketing, support, and project data, build custom KPIs that Intuit's own reporting doesn't cover, and report across IES alongside entities that sit on a different accounting system entirely, such as a subsidiary still running Zoho Books or Xero.
What are the benefits of financial analytics software?
- By using a self-service financial analytics software, businesses can achieve the following
benefits:
- Monitoring financial health and performance in real-time
- Generating financial estimates easily to finest accuracy
- Gain a peek into the end-to-end financial operations
- Improved decision-making and collaboration with peers
- Enhanced accessibility to insights across all levels in the business hierarchy
Why choose Zoho Analytics as your financial analytics software?
- Zoho Analytics is a powerful self-service financial analytics software that offers the entire
spectrum of BI & Analytics capabilities. Data integration across a wide variety of data sources
(including popular financial software applications, local and cloud databases, spreadsheets etc)
Data preparation to improve the veracity of dataVisual analysis to derive meaning out of raw
data using insightful visualizations. Augmented analytics that provides AI-powered analytical
capabilities like AskZia (for conversational analytics), Zia Insights (auto-generated insights)
and forecasting (to predict future trends).
- Our business intelligence platform can be deployed in on-premise, cloud, or multi-cloud environments. Know more about the complete set of features of Zoho Analytics.
Is Zoho Analytics secure enough for sensitive financial data?
- Yes. Zoho Analytics is SOC 2 Type II certified, GDPR-compliant, and offers data residency options across multiple global regions. Key security features include: row-level security (each user sees only their permitted data), full audit trail logging, encryption at rest and in transit, two-factor authentication, and IP restriction controls. Zoho's own security infrastructure is also independently audited annually, making it suitable for finance teams in regulated industries.
What is Zia, and what can it do for financial analytics?
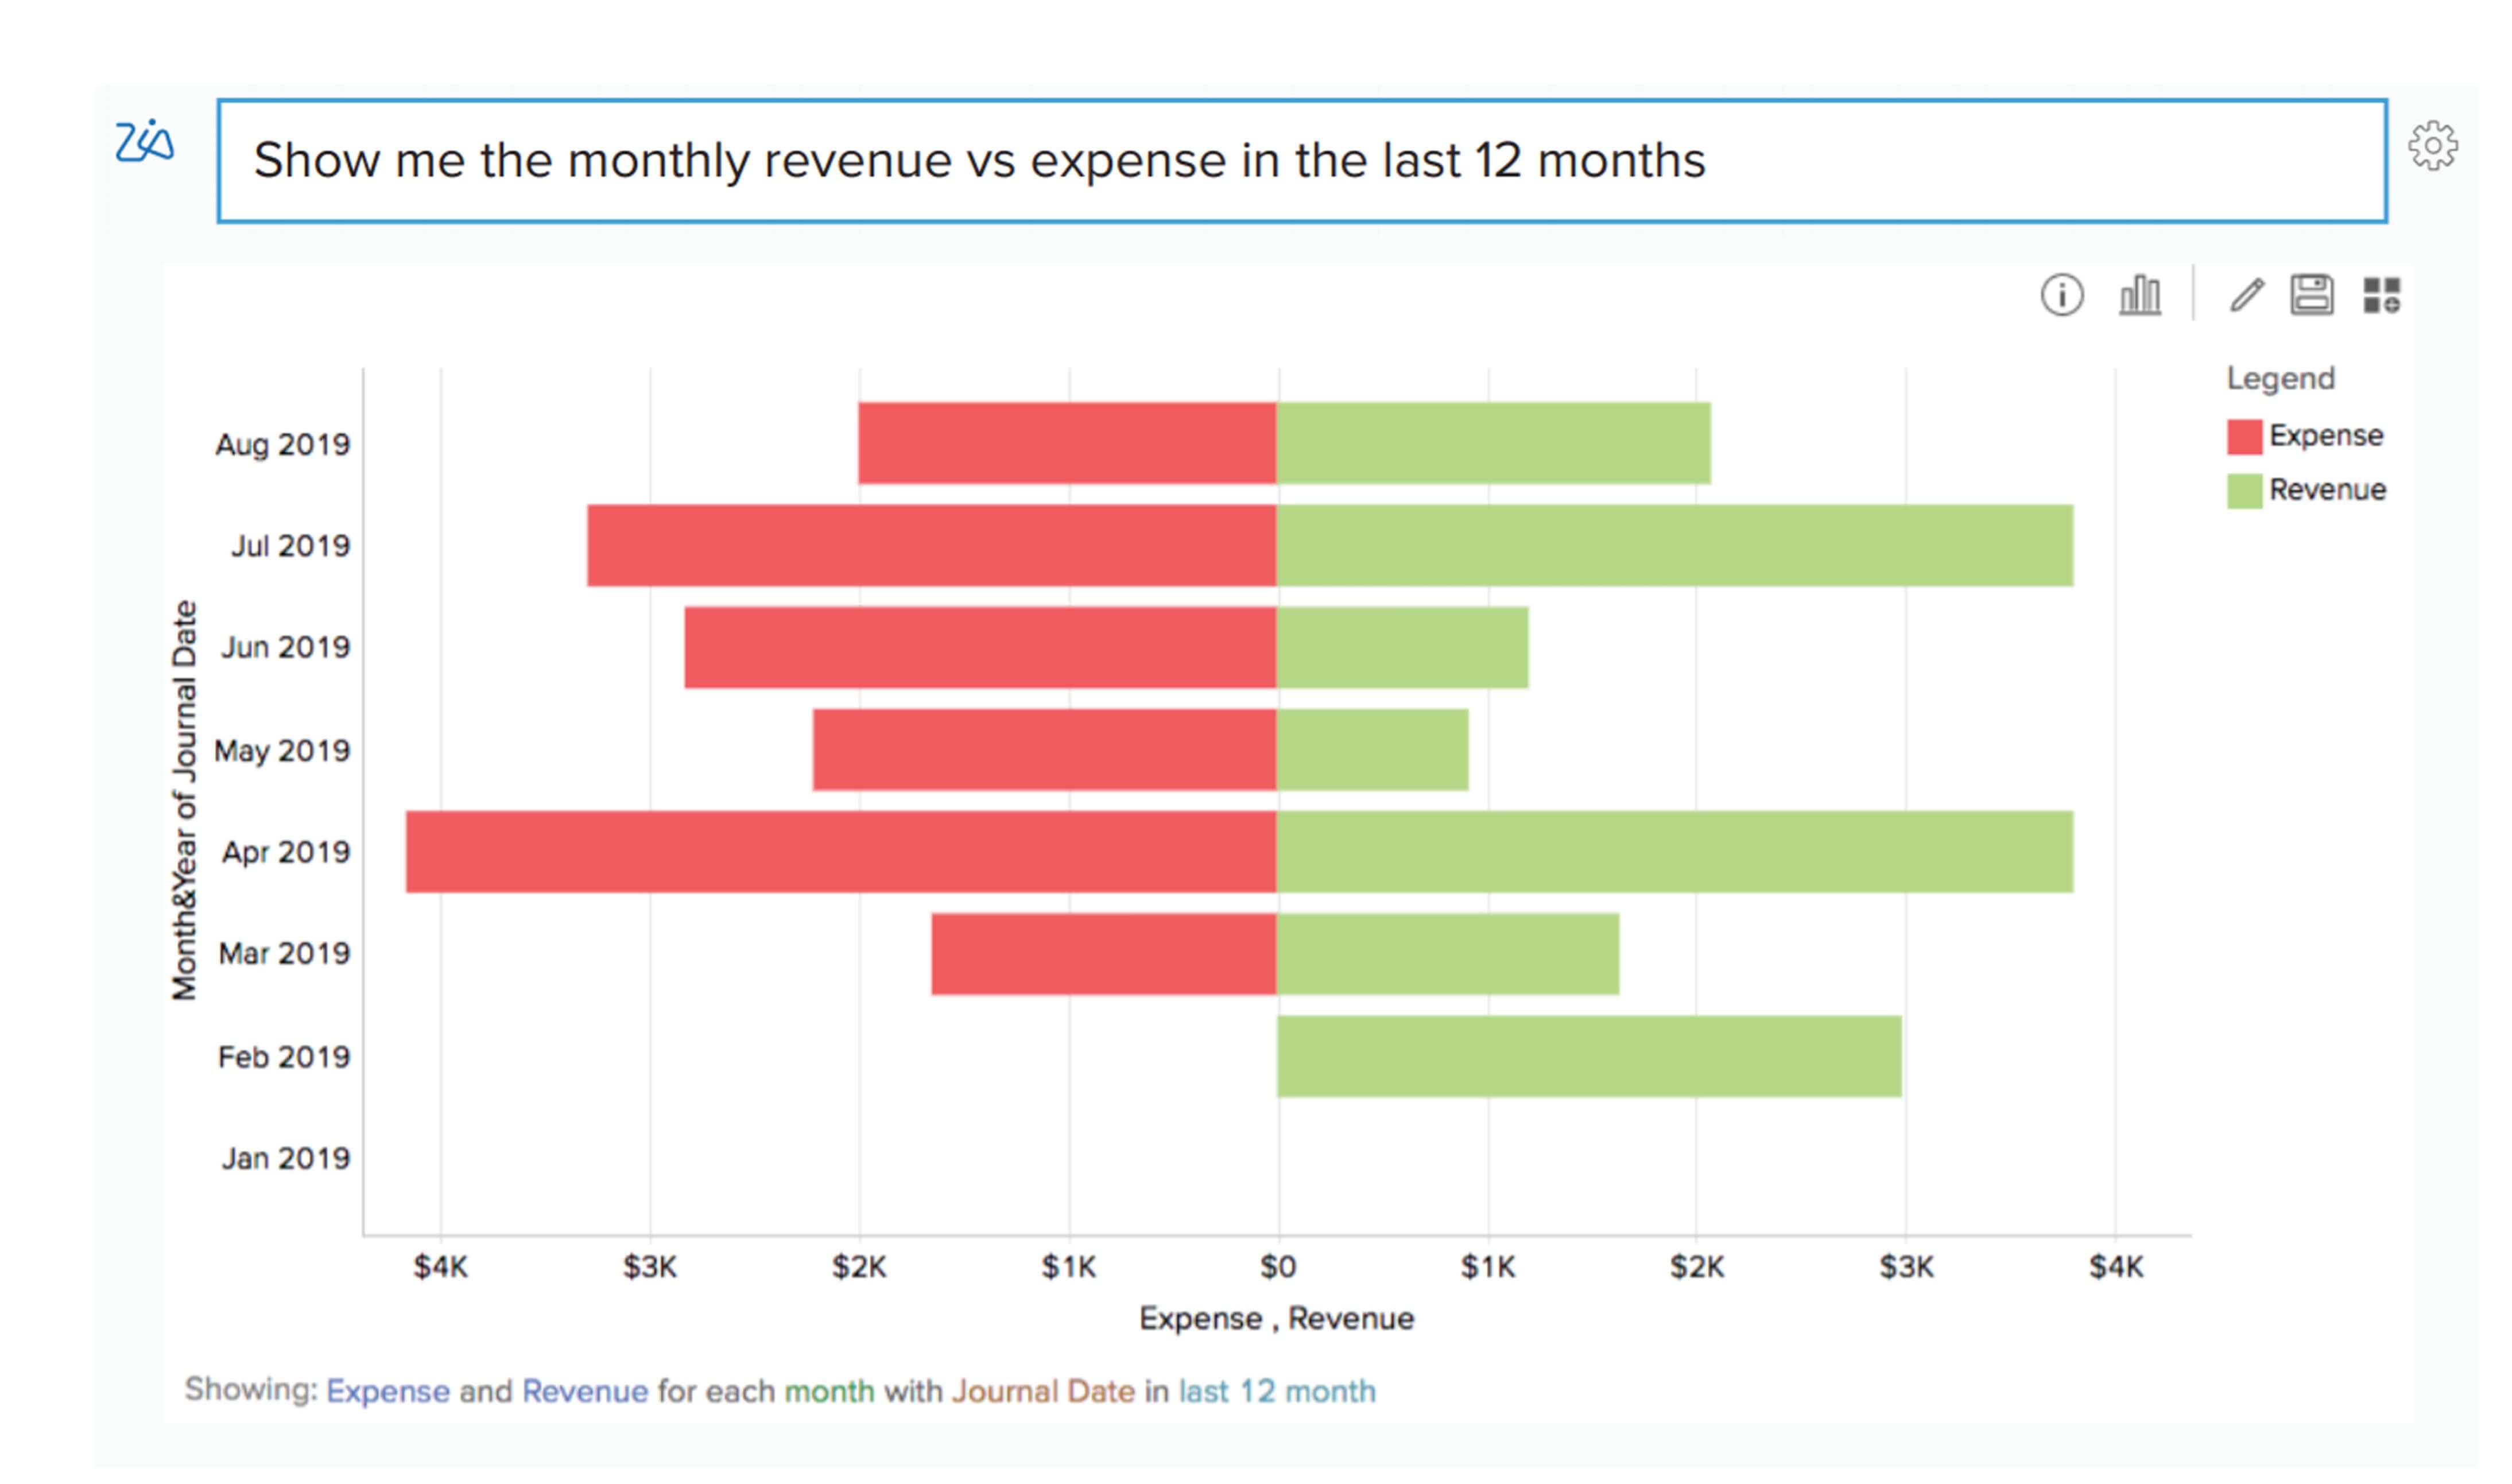
- Zia is Zoho Analytics' built-in AI assistant, designed specifically for business intelligence workflows. For finance teams, Zia can: answer natural-language questions about your financial data (e.g., "What's our cash burn rate this quarter?"), auto-generate narrative summaries for board reports, detect statistical anomalies in your KPIs and alert you before they escalate, and produce ML-based forecasts for revenue, expenses, and cash flow based on your historical data trends, with no data science background required.
Can I embed financial dashboards in our internal tools or client portals?
- Yes, Zoho Analytics offers embedded and white-label analytics options. You can embed dashboards and reports directly into your internal intranet, product, or client-facing portal using iframe embedding, SSO authentication, or the Embed API. Dashboards appear fully branded with zero Zoho branding, and row-level security ensures each embedded user sees only their own data. This is widely used by accounting firms, financial services platforms, and SaaS businesses to deliver analytics to clients.