- HOME
- BI & Analytics
- 10 Core Features Every Modern BI Tool Must Have
10 Core Features Every Modern BI Tool Must Have
- Last Updated : April 7, 2026
- 1.1K Views
- 15 Min Read
Business intelligence tools have become a core part of how organizations operate. According to a 2024 Dresner Advisory Services report, 55% of organizations now consider BI and analytics critical to their business strategy, yet many teams still struggle to extract value from the tools they use.
The gap often comes down to a mismatch between what a BI tool offers and what a team actually needs. A modern BI tool should not just generate reports, it should help every team member make faster, more confident decisions, regardless of their technical background.
This guide covers the 10 features that define a capable BI tool in 2026, what to look for in each, and how they translate to real business outcomes. Understanding the features of modern BI tools also helps contextualize where AI in business intelligence fits into your strategy.
Not sure where to start? Here's how to choose the right BI tool for your business.
10 Core Features Every Modern BI Tool Must Have
- Self-Service Interface and Ease of Use
- Seamless Data Connectivity
- AI-Powered Analytics and Natural Language Queries
- Predictive Analytics and Machine Learning
- Interactive Data Visualization
- Real-Time Collaboration and Sharing
- Data Governance, Security, and Scalability
- Mobile Access and Cross-Device Analytics
- Deployment Flexibility and Multi-Tenancy
- Embedded Analytics and White-Label Support
TRY ZOHO ANALYTICS - THE MODERN BI TOOL
Self-service interface and ease of use
A BI tool is only as powerful as its adoption rate. If analysts and business users alike cannot navigate the tool independently, it becomes shelf-ware.
A genuinely self-service interface means non-technical users like marketing managers, operations leads, and finance teams, can build their own reports and dashboards without filing a ticket to IT. Key indicators include drag-and-drop report builders, guided dashboard creation, built-in tips, and a clean layout that does not require a manual to interpret.
This is distinct from tools that claim to be the best self-service but still require SQL knowledge or scripting for any meaningful analysis. To evaluate this, test how long it takes a non-analyst to build their first useful dashboard from scratch.
Why it matters in practice: A retail chain deploying a BI tool across 50 store managers needs every manager to pull their own sales data by region and not wait three days for a report from headquarters. Self-service BI tools reduce bottlenecks and accelerate decision cycles at every level of the organization.
See how Zoho Analytics ranks among the best self-service BI tools available today.
What to look for: Drag-and-drop interface, natural language querying, no-code report creation, role-based guided workflows.
Seamless data connectivity
Most organizations do not have a single source of truth. They have a CRM, an ERP, a marketing platform, a helpdesk, a billing system, and spreadsheets scattered across teams. A BI tool that cannot bring all of this together forces analysts to spend more time on data wrangling than on analysis.
So, look for pre-built connectors to popular business tools (Salesforce, HubSpot, QuickBooks, Google Analytics), cloud databases (MySQL, PostgreSQL, BigQuery, Snowflake), and file formats (CSV, Excel). Beyond volume of connectors, evaluate reliability: do live syncs stay current, or do they break when schemas change?
Also assess data preparation capabilities. Raw data from disparate sources rarely arrives clean. The ability to join, transform, and clean data within the platform without exporting to Excel is a significant time-saver.
Why it matters in practice: A SaaS company evaluating churn needs data from their CRM, product usage logs, and billing platform simultaneously. Without unified connectivity, correlating these signals requires manual merges that introduce lag and errors.
What to look for: 500+ pre-built connectors, live sync options, API access, built-in data preparation and transformation tools.
AI-powered analytics and natural language queries
AI capabilities in BI tools reduce analysis time by automating pattern detection, trend forecasting, and anomaly surfacing. More importantly, they lower the barrier to insight. A business user can ask "What drove the revenue drop in Q3?" in plain English and receive a structured answer, not just a chart.
While choosing an AI-powered BI tool, evaluate AI features across two dimensions: automation (what does the tool surface without being asked?) and interaction (how natural and accurate is the conversational query interface?).
Beware of tools that label basic bar chart generation as "AI." Genuine AI capabilities include auto-generated narrative summaries, smart chart recommendations, automated anomaly alerts, and conversational analytics that understand context across multiple queries.
Why it matters in practice: A marketing manager asking "Which campaign had the highest cost-per-acquisition last month compared to the previous quarter?" should get an immediate, accurate answer. Not a blank query builder.
What to look for: Natural language querying, automated insight generation, smart anomaly detection, AI-driven narrative summaries.
Learn more about AI in business intelligence and how it transforms decision-making.
Predictive analytics and machine learning
Descriptive analytics tells you what happened. Predictive analytics tells you what is likely to happen and gives your team the lead time to respond.
In 2026, predictive capabilities are no longer reserved for data science teams. So look for BI tools that offer no-code or low-code forecasting models for revenue projections, churn prediction, demand forecasting, and anomaly-based alerting.
Evaluate whether the tool lets business users apply models to their own datasets without writing code, and whether predictions come with confidence intervals or explanatory factors so users understand why a forecast was generated.
Why it matters in practice: A supply chain team that can predict a 20% demand spike in a product category three weeks out can pre-position inventory accordingly. Without predictive analytics baked into the BI platform, that kind of forward-looking insight requires a separate data science workflow which slows down response time considerably.
What to look for: Forecasting models, automated trend projection, no-code machine learning, confidence scoring.
Zoho Analytics' no-code DSML Studio lets teams build and deploy custom ML models directly within dashboards.
Interactive data visualization
Charts are table stakes. What differentiates a strong BI tool's visualization layer is interactivity: the ability to drill down from a summary metric into the underlying transaction-level data, apply dynamic filters that update the entire dashboard, and navigate across related datasets without leaving the view.
Look for a wide variety of chart types like bar, line, scatter, heatmap, treemap, geo map, Sankey, alongside customization options that let teams brand and structure dashboards for different audiences. Because a marketing dashboard for leadership looks different from a daily ops dashboard for a logistics team.
Also check whether data visualizations are responsive across devices, particularly mobile, and whether KPI dashboards update in real time.
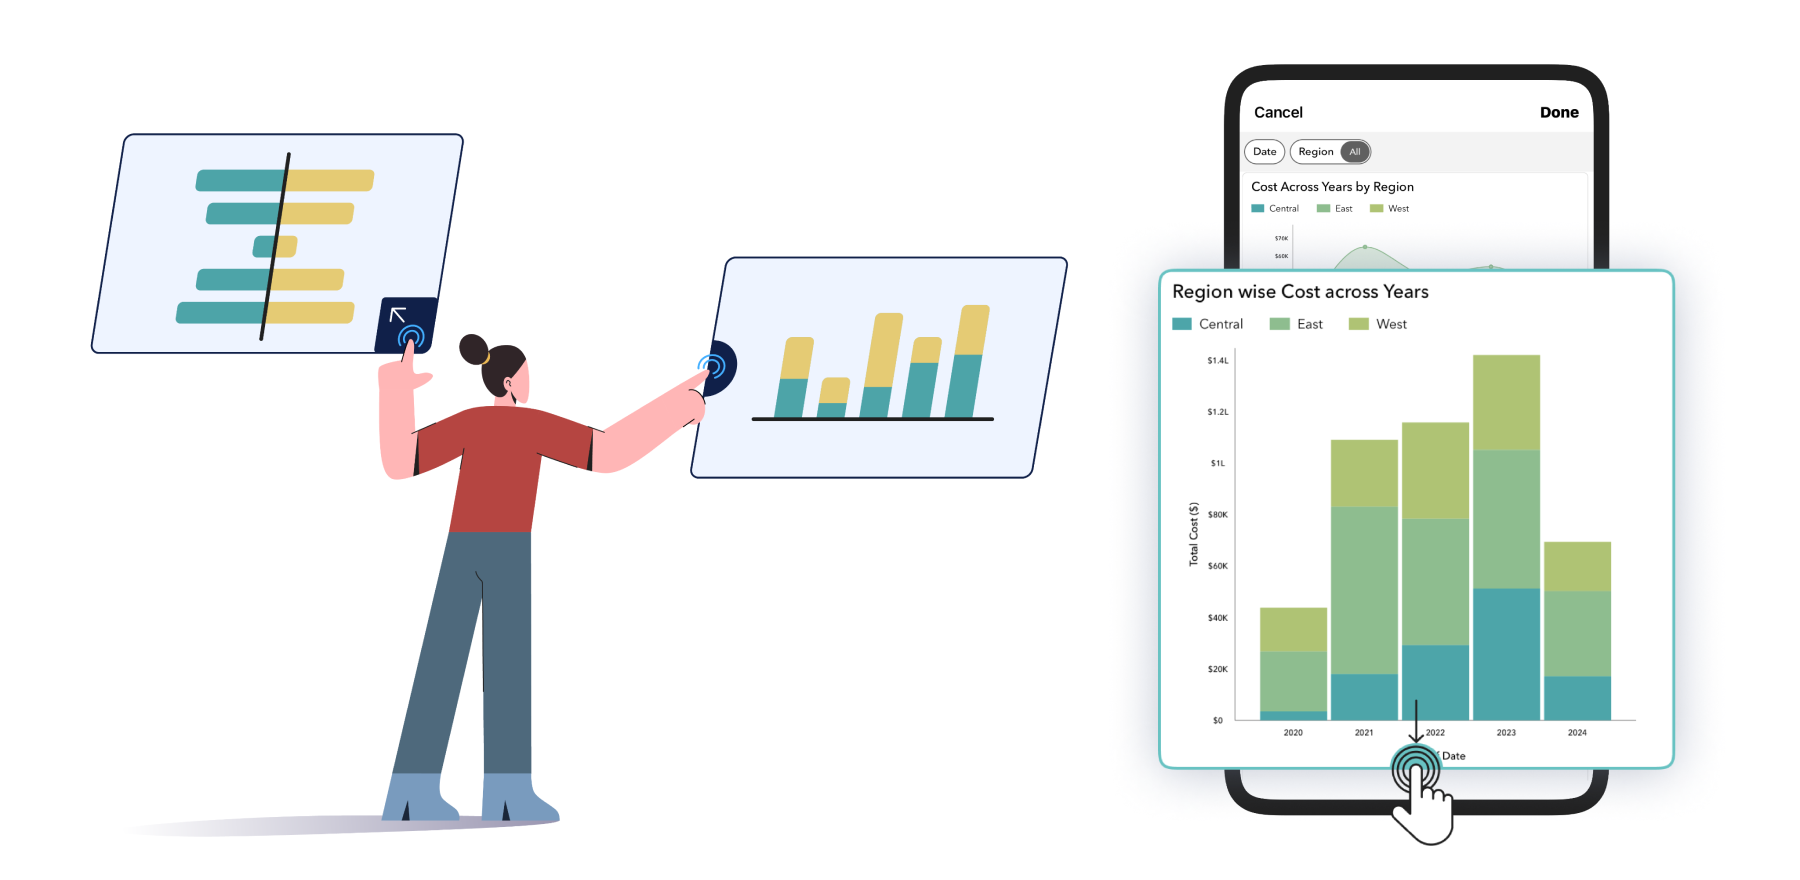
Why it matters in practice: An executive reviewing monthly performance on a tablet should be able to tap on an underperforming region and drill into the contributing factors without switching devices or asking an analyst to pull a follow-up report.
What to look for: 50+ visualization types, drill-down and cross-filtering, conditional formatting, responsive layouts, data visualization dashboards, geo mapping.
Real-time collaboration and sharing
Insights only create value when they reach the people who can act on them. A BI tool should make it easy to share reports securely, embed dashboards inside existing applications or portals, schedule automated report delivery, and enable in-context commenting on specific data points.
Role-based access controls also matter here. Different stakeholders need different levels of access. A CFO and a regional sales manager should see the same dashboard but with data filtered to their scope, without requiring separate report versions.
So evaluate whether the platform supports embedded analytics - the ability to surface BI components directly inside your product or internal tools, and collaborative analytics features like annotations and shared workspaces.
Why it matters in practice: A customer success team that can annotate anomalies in a churn dashboard and tag the responsible account manager directly within the BI tool closes the feedback loop faster than any email chain.
What to look for: Role-based access, scheduled email reports, embedded dashboards, comment threads on reports, white-label options.
Data governance, security, and scalability
As BI adoption grows within an organization, governance becomes critical. Who can see what data? How is PII handled? What happens when headcount doubles and the number of dashboards triples?
Strong governance means row-level security (so users only see the data relevant to their role), audit logs (so admins can track who accessed what), and compliance certifications relevant to your industry (SOC 2, GDPR, HIPAA). Scalability means the platform handles increasing data volumes and concurrent users without degrading performance.
This is particularly important for organizations deploying cloud BI at scale or embedding analytics in customer-facing products where data isolation between tenants is non-negotiable.
Why it matters in practice: A healthcare analytics team sharing patient outcome dashboards with clinical staff needs row-level security that ensures a nurse in one ward cannot access records from another, while the CMO gets an aggregated view across all wards, all from the same dashboard.
What to look for: Row-level security, SSO/MFA, audit logging, SOC 2/GDPR/HIPAA compliance, multi-tenancy support, scalable cloud architecture.
Mobile access and cross-device analytics
Decisions don't wait for a desk. Field sales teams, operations managers, and executives need access to live dashboards and alerts on mobile, not a degraded mobile version of a desktop interface.
A capable BI tool should offer a purpose-built mobile BI experience: responsive dashboards that reflow intelligently on smaller screens, push notifications for threshold-based alerts, and offline access for teams operating in low-connectivity environments. The key distinction is between a tool that is mobile-compatible (it technically opens on a phone) and one that is mobile-optimized (designed for touch-first interactions with the right data density for a 6-inch screen).
While evaluating, check whether mobile access is included in the base plan or gated behind an enterprise tier, and whether the experience supports the full range of interactivity like filtering, drill-down, commenting, not just read-only viewing.
Why it matters in practice: A regional operations manager reviewing daily store performance during a site visit should be able to spot a revenue anomaly, drill into the underperforming location, and share a filtered view with the store manager - all from a phone, before walking through the door.
What to look for: Native iOS and Android apps, push alert notifications, touch-optimized dashboards, offline access, mobile BI capabilities that match desktop functionality.
Deployment flexibility and multi-tenancy
Not every organization operates under the same infrastructure constraints. A regulated financial institution may require on-premise deployment or a private cloud. A fast-growing SaaS company may need a fully managed cloud setup. A global enterprise may need both, deployed across regions, with strict data residency controls.
Deployment flexibility means the BI platform supports cloud, on-premise, and hybrid configurations and transitions between them without requiring a full migration or data re-architecture. Multi-tenancy is particularly critical for software vendors embedding analytics in their product: each customer's data must be completely isolated from every other tenant, with no cross-contamination risk regardless of how queries are structured.
While choosing a BI tool, check whether tenant-level customization (branding, data access, feature access) is configurable independently per client, and whether the platform's architecture is designed for multi-tenancy from the ground up rather than bolted on as an afterthought.
Why it matters in practice: A HR SaaS platform serving 500 enterprise clients needs each client to see only their own workforce data, with their own logo on the dashboard, their own admin controls, and zero possibility of one client's query surfacing another's records. That requires native multi-tenant architecture, not workarounds.
What to look for: Cloud, on-premise, and hybrid deployment options, data residency controls, tenant-level isolation, per-tenant branding and access control, cloud BI with configurable infrastructure.
Embedded analytics and white-label support
The most impactful analytics experiences are often invisible, surfaced directly inside the workflow, application, or portal where work is already happening, rather than requiring a context switch to a separate BI tool.
Embedded analytics allows product teams and enterprises to integrate reports, dashboards, and AI-powered insights directly into their own applications using iFrame, APIs, or SDKs with no visible trace of the underlying vendor. White-label support extends this further: custom domain, custom branding, custom login pages, and complete brand ownership of the analytics experience.
While evaluating, check the depth of the embedding options: can you embed individual charts, full dashboards, or the entire analytics workspace? Is single sign-on (SSO) supported so end users don't face a separate login? And critically, is row-level security enforced at the embedded layer so users only see the data they are authorized to access?
Why it matters in practice: A logistics platform that surfaces live shipment performance dashboards inside its customer portal is branded as its own product, not as "powered by Zoho Analytics" and delivers a differentiated customer experience while avoiding the cost of building analytics infrastructure from scratch.
See how embedded analytics works and how white-label reporting enables fully branded deployments.
What to look for: iFrame, API, and SDK embedding options, SSO support, row-level security at the embedded layer, white-label domain and branding, embedded dashboards with multi-tenant isolation.
"We have embedded Zoho Analytics within our internally developed financial services software. Whenever I have a new client meeting, I demonstrate the Ask Zia feature of Zoho Analytics with a question like "what was my income last month?" It's quick reply or a visual fascinates my clients and they say, 'This is what we want'. It allows me to show them that we are a forward thinking company partnered with a global company like Zoho."
Craig Roxby
Managing Director, Magnifi
Zoho Analytics: Built for every feature a modern BI tool must have
Finding a BI tool that genuinely delivers on all ten of these features - not just checks boxes on a marketing page - is harder than it sounds. Most tools do a few things well and leave gaps elsewhere. You end up with a strong visualization layer but a weak mobile experience, or solid AI features that only work if your data team sets them up.
Zoho Analytics is built differently. It brings every one of these capabilities together in a single platform, designed in a way that a business analyst and a data engineer can both get value from it on day one, without either of them feeling like they're using the wrong tool.
Here's what that looks like in practice.
- Easy enough for anyone, powerful enough for experts
- Connect everything - 500+ data sources, no engineering required
- Ask Zia: your AI analyst, always on
- Predict what's coming, not just what happened
- Visualize data the way your audience actually understands it
- Collaborate on insights, not just reports
- Enterprise security, without the enterprise complexity
- Mobile BI that actually works on a phone
- Embedded analytics and white-label dashboards for teams building products
Easy enough for anyone, powerful enough for experts
The first thing most teams notice about Zoho Analytics is how quickly they can get started. There's no steep onboarding curve, no mandatory training sessions, no waiting for IT to set things up. You connect your data, and within minutes you're building reports using a drag-and-drop interface that genuinely feels intuitive.
Non-technical users like sales managers, marketing leads, finance teams can create their own dashboards and answer their own questions without filing a request to the data team. That's not a small thing. It's the difference between a BI tool that gets used every day and one that collects dust after the initial rollout.
And for analysts and power users who want to go deeper? The platform scales with them with SQL mode, custom calculations, advanced data modeling, no-code machine learning via DSML Studio. Both audiences can work in the same environment, on the same data, at the same time.
Connect everything - 500+ data sources, no engineering required
Your data lives in a lot of places. CRM, marketing tools, finance software, cloud databases, spreadsheets, product logs. Zoho Analytics connects to over 500 native data sources including Zoho CRM, Salesforce, HubSpot, Google Analytics, QuickBooks, MySQL, BigQuery, Snowflake, and more with pre-built connectors that don't require custom engineering work to set up.
Once connected, data syncs automatically. You're not manually refreshing exports or reconciling mismatched timestamps. And when data arrives messy, which it usually does, the built-in data preparation layer lets you clean, join, and transform it before it ever reaches a dashboard.
Ask Zia: your AI analyst, always on
One of the most practical features in Zoho Analytics is Ask Zia, the built-in AI assistant. Instead of building a query or hunting through dashboards, you type a question in plain English - "What were my top-performing campaigns last quarter?" or "Show me revenue by region compared to the same period last year" and Zia returns both a text answer and a visual chart instantly.
But Zia does more than answer questions. It proactively surfaces insights you didn't know to ask for such as spotting anomalies in your data, flagging unusual trends, and generating narrative summaries that explain what's happening and why. With Generative AI capabilities, it can even draft automated board-level summaries or performance commentary from your dashboards.
This is what AI in BI should actually look like. Not a chatbot that rephrases your data, but an assistant that adds genuine analytical value.
"The Ask Zia and Zia Insights features are so cool. I can ask for a specific agent name for their quarterly or monthly performance and get to see if their sales numbers are trending up or down, and from which geographic areas their sales are coming from. I can also dive into why they can't close deals in other areas and try to replicate the successful ones."
John Sheldon
Business Intelligence Manager, Renu Energy Solutions
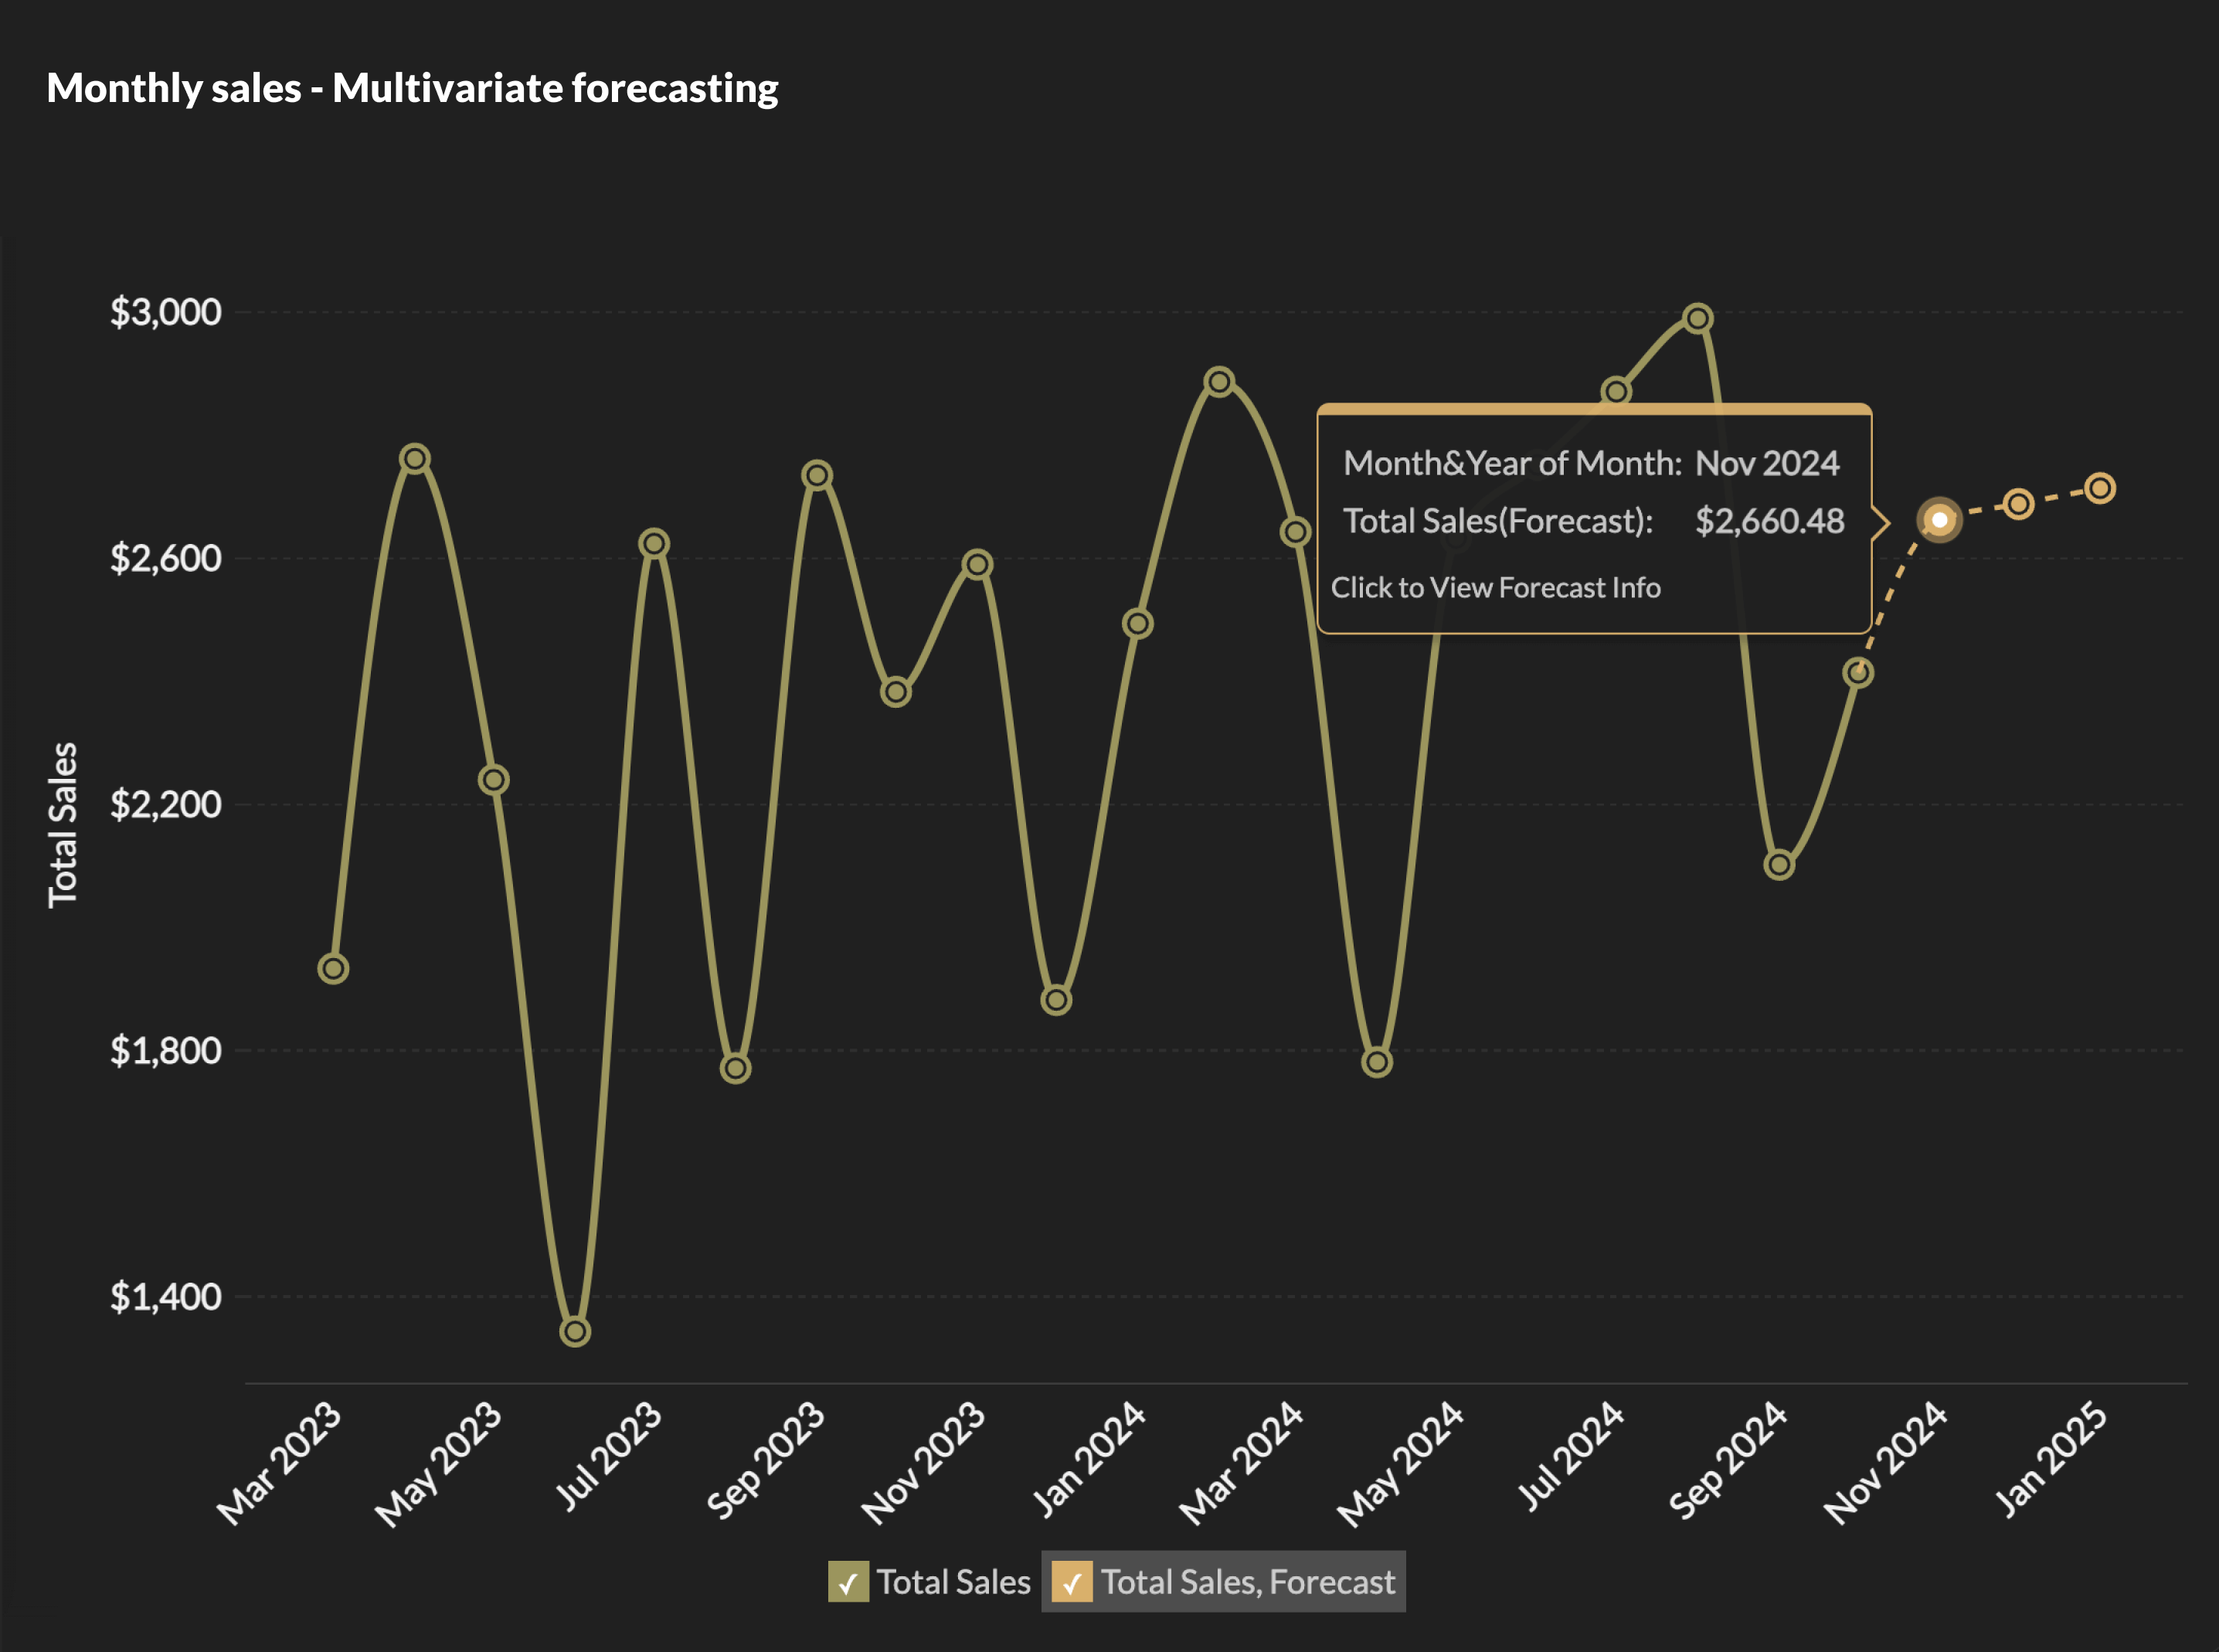
Predict what's coming, not just what happened
Zoho Analytics goes beyond descriptive analytics. The predictive analytics layer lets teams build forecasting models for revenue, churn, inventory demand, and more, all without writing a single line of code.
With the no-code DSML Studio, a business analyst can build a customer churn prediction model, validate it against historical data, and deploy it directly inside a dashboard, all within the same platform where they build their reports. No separate data science tools, no hand-offs, no waiting.
Visualize data the way your audience actually understands it
Zoho Analytics offers more than 50 chart types like bar, line, pie, scatter, heatmap, treemap, Sankey, geo map, KPI tiles, and more with deep customization options so dashboards can be tailored for different audiences.
An executive summary dashboard looks different from a daily operations view, which looks different from a deep-dive analyst workspace. With Zoho Analytics, you can build all three, apply conditional formatting to highlight what matters, and use drill-down and cross-filtering so viewers can follow a question from the summary level all the way down to the transaction level, without leaving the dashboard.
KPI dashboards update in real time, so the numbers your team is looking at always reflect the current state of the business.
Collaborate on insights, not just reports
Zoho Analytics treats collaboration as a first-class feature, not an afterthought. Share dashboards with specific people or teams with role-based access controls so a regional manager sees their region's data, while the VP sees everything. Add comments directly on data points. Schedule automated email reports. Set up alerts that notify the right people the moment a KPI crosses a threshold.
For teams that work across tools, collaborative analytics means insights don't stay locked inside the BI reporting platform, they flow to where decisions actually get made.
Enterprise security, without the enterprise complexity
Zoho Analytics takes data security seriously without making it painful to manage. Row-level security ensures every user only sees the data they're authorized to access, even when they're looking at the same dashboard as a colleague with broader permissions. SSO with SAML and OAuth, multi-factor authentication, AES-256 encryption at rest, TLS in transit, audit logging, and compliance with SOC 2, GDPR, and HIPAA mean security teams have the controls they need from day one.
And because Zoho Analytics supports cloud BI, on-premise, and hybrid deployment, you can meet data residency requirements without sacrificing the platform capabilities your team depends on.
Mobile BI that actually works on a phone
The Zoho Analytics mobile BI apps for iOS and Android aren't stripped-down versions of the desktop. Dashboards reflow intelligently for touch-first use, filters and drill-downs work as expected, and push notifications fire when an alert condition is met, so your team never needs to be at a desk to stay on top of the numbers.
Embedded analytics and white-label dashboards for teams building products
If you're a software vendor or an agency delivering analytics to clients, Zoho Analytics gives you the full toolkit. Embed reports and dashboards directly into your application using iFrame, APIs, or SDKs. Apply your brand, your logo, your domain, your color scheme with complete white-label reporting support. Each client's data is fully isolated with row-level security and multi-tenant architecture, so there's no risk of data crossing between accounts.
The result of embedded analytics is a production-ready analytics experience your clients see as your own product and not as a third-party tool you've bolted on.
One platform. No gaps. Zoho Analytics.
Most BI tools make you choose between power and usability, or between features and affordability. Zoho Analytics doesn't. Whether you're a 20-person startup building your first dashboard or a 10,000-person enterprise deploying analytics across departments and embedding them in a customer-facing product, the platform covers the full range without requiring you to stitch together multiple tools to get there.
"Zoho Analytics provides an impressive breadth of capabilities at a price point that makes it accessible to organizations that previously couldn't afford enterprise BI." - Analyst recognition, Gartner Peer Insights.
See all analyst and industry quotes about Zoho Analytics as a BI platform.
"Zoho Analytics has moved us from reactive reporting to proactive, insight-driven decision-making. The ability to drill down into real-time data and track recurring revenue trends has helped us optimize pricing, forecast demand, and identify new growth opportunities with confidence."
Aaron Mooney
CEO, Action24
Ready to see what modern BI looks like when all ten features work together? Start your free trial or book a personalized demo.
Zoho Analytics: The modern BI solution that clears the path.
 Vinisha
Vinisha is a Marketing Analyst at Zoho Analytics with a strong passion for both marketing and data. She’s naturally curious about trends and loves diving into data to uncover what drives effective campaigns. She has a knack for simplifying complex information and presents insights in a relatable and engaging way that connects with audiences. Outside of work, she enjoys exploring the creative side of digital marketing.