Admin Reports - Email Statistics
Zoho Mail has a separate Admin Reports section which comprises statistics on various aspects of your organization's emailing experience. As an administrator, these reports will help you gain information on all aspects of your organization such as Mailbox, Email Traffic, Email Distribution Groups, DMARC status to mention a few.
Accessing Admin Reports
- Log in to Zoho Mail Admin Console.
- On the left pane, click on the Reports section. The Admin Reports will open in a new tab.
Admin Reports Dashboard
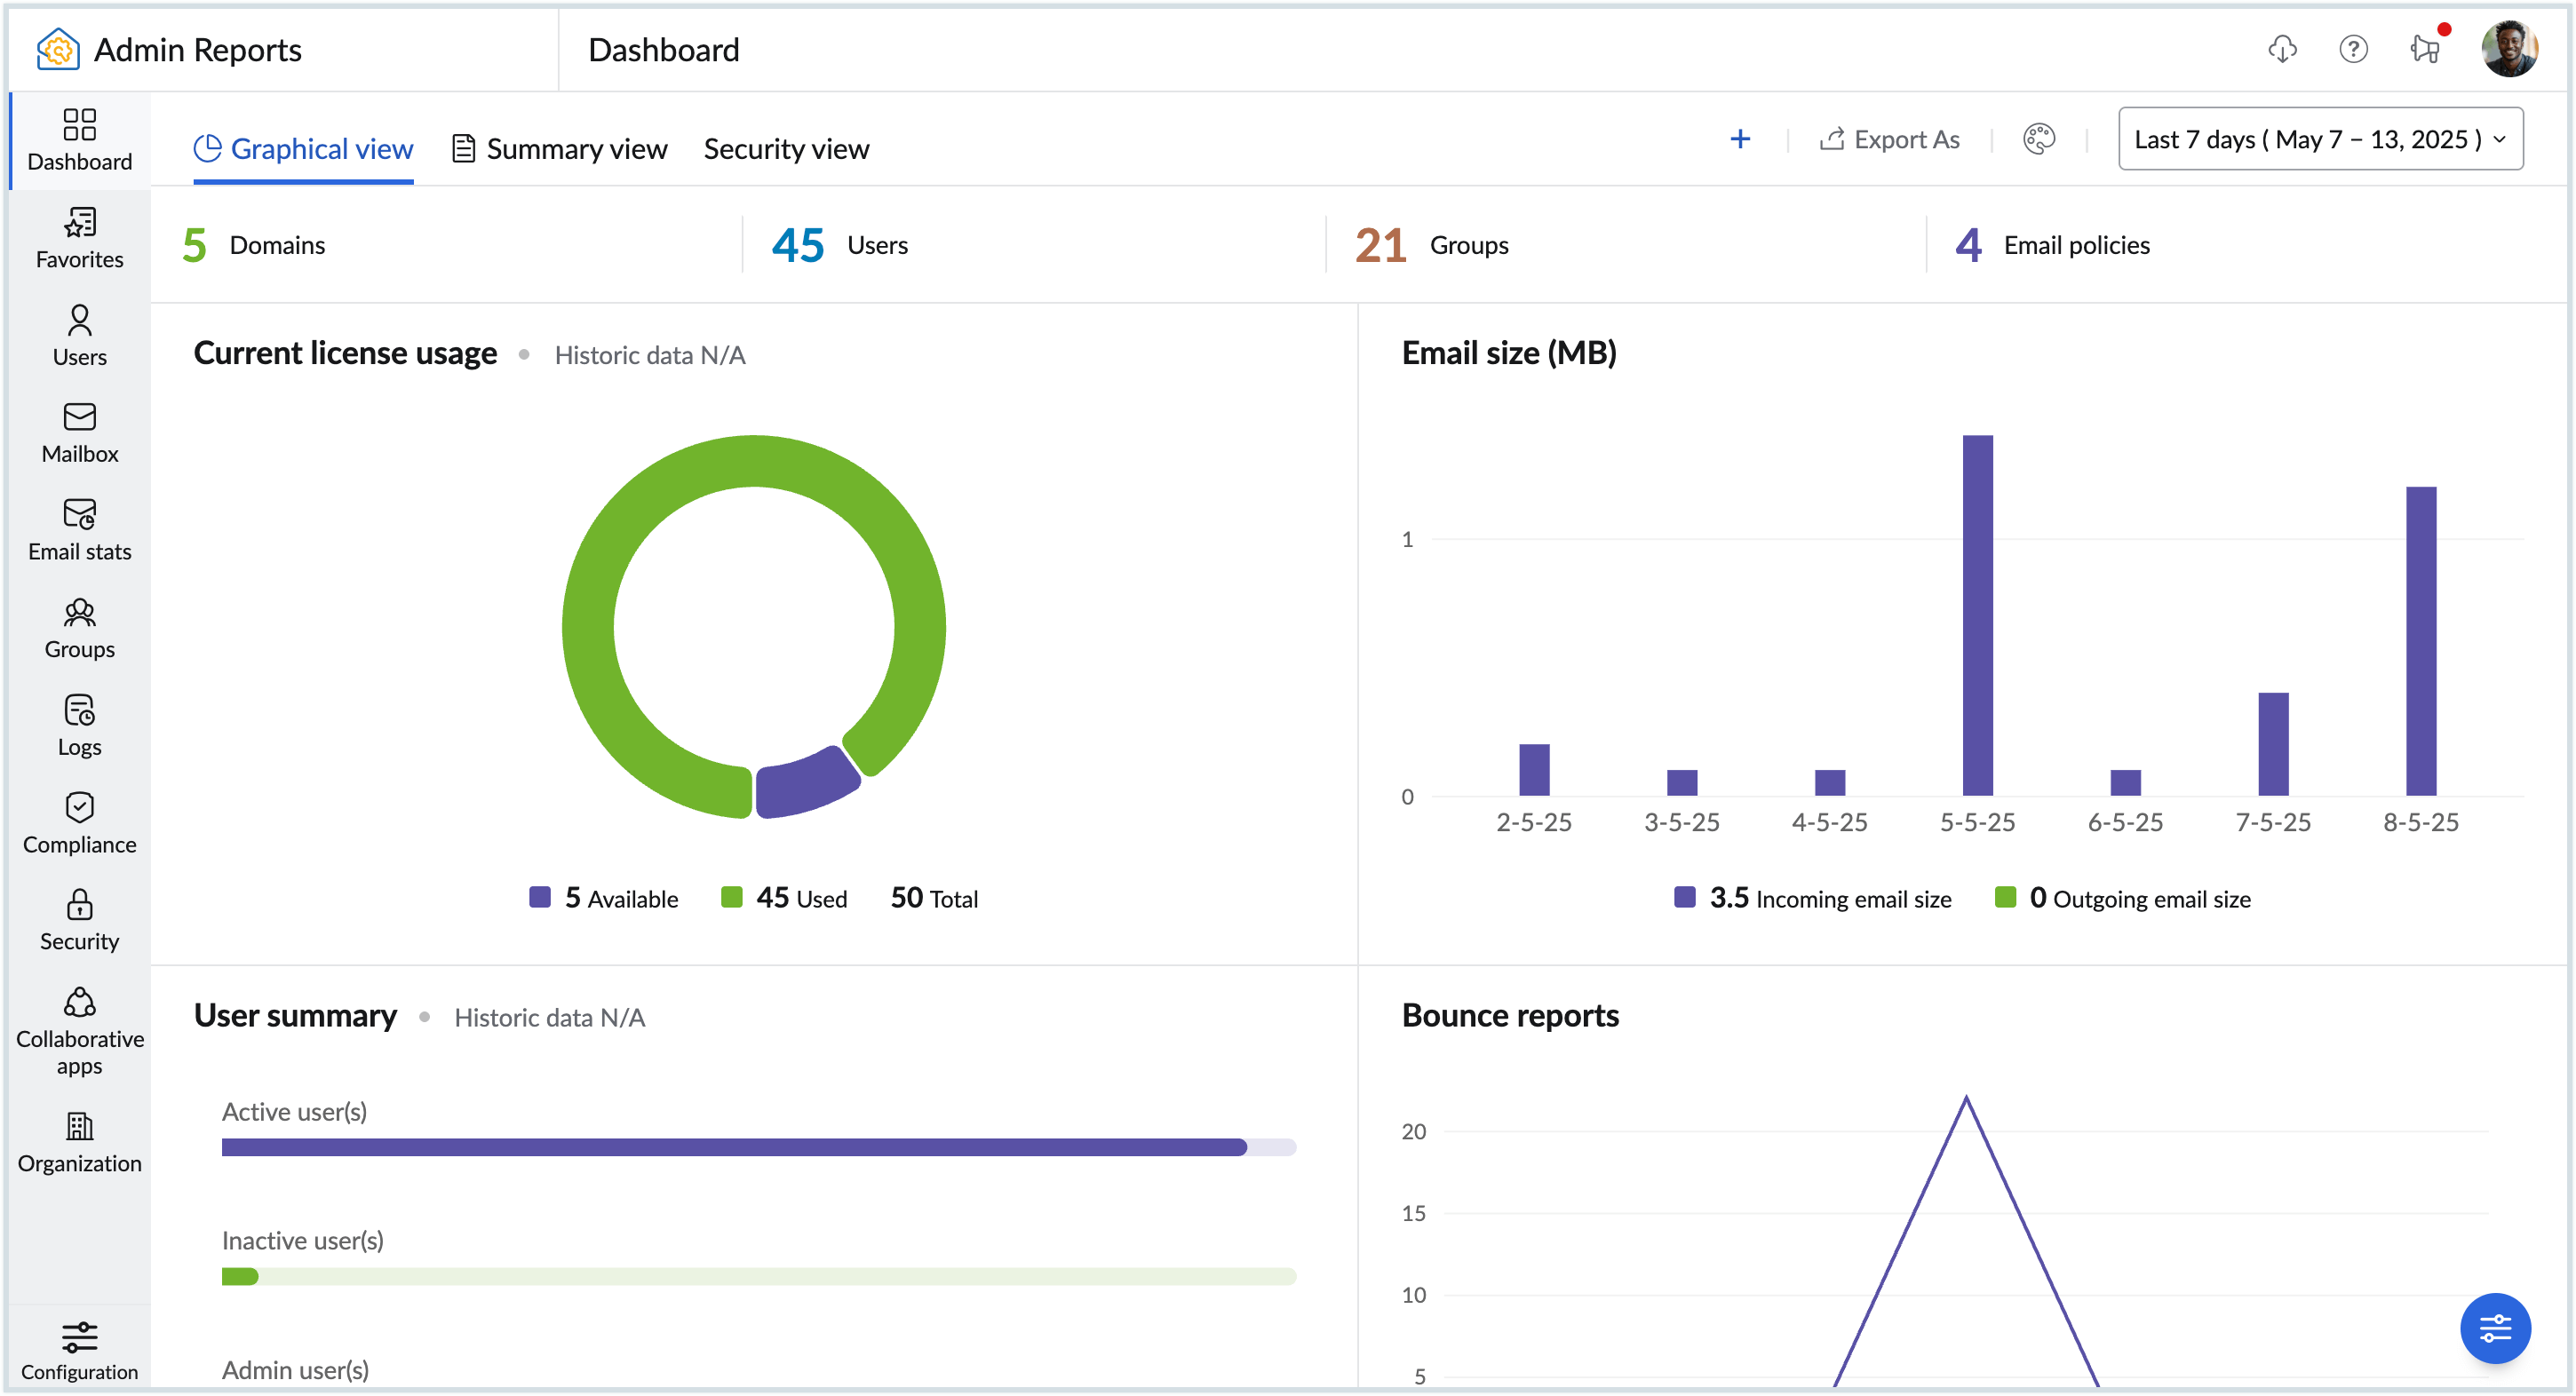
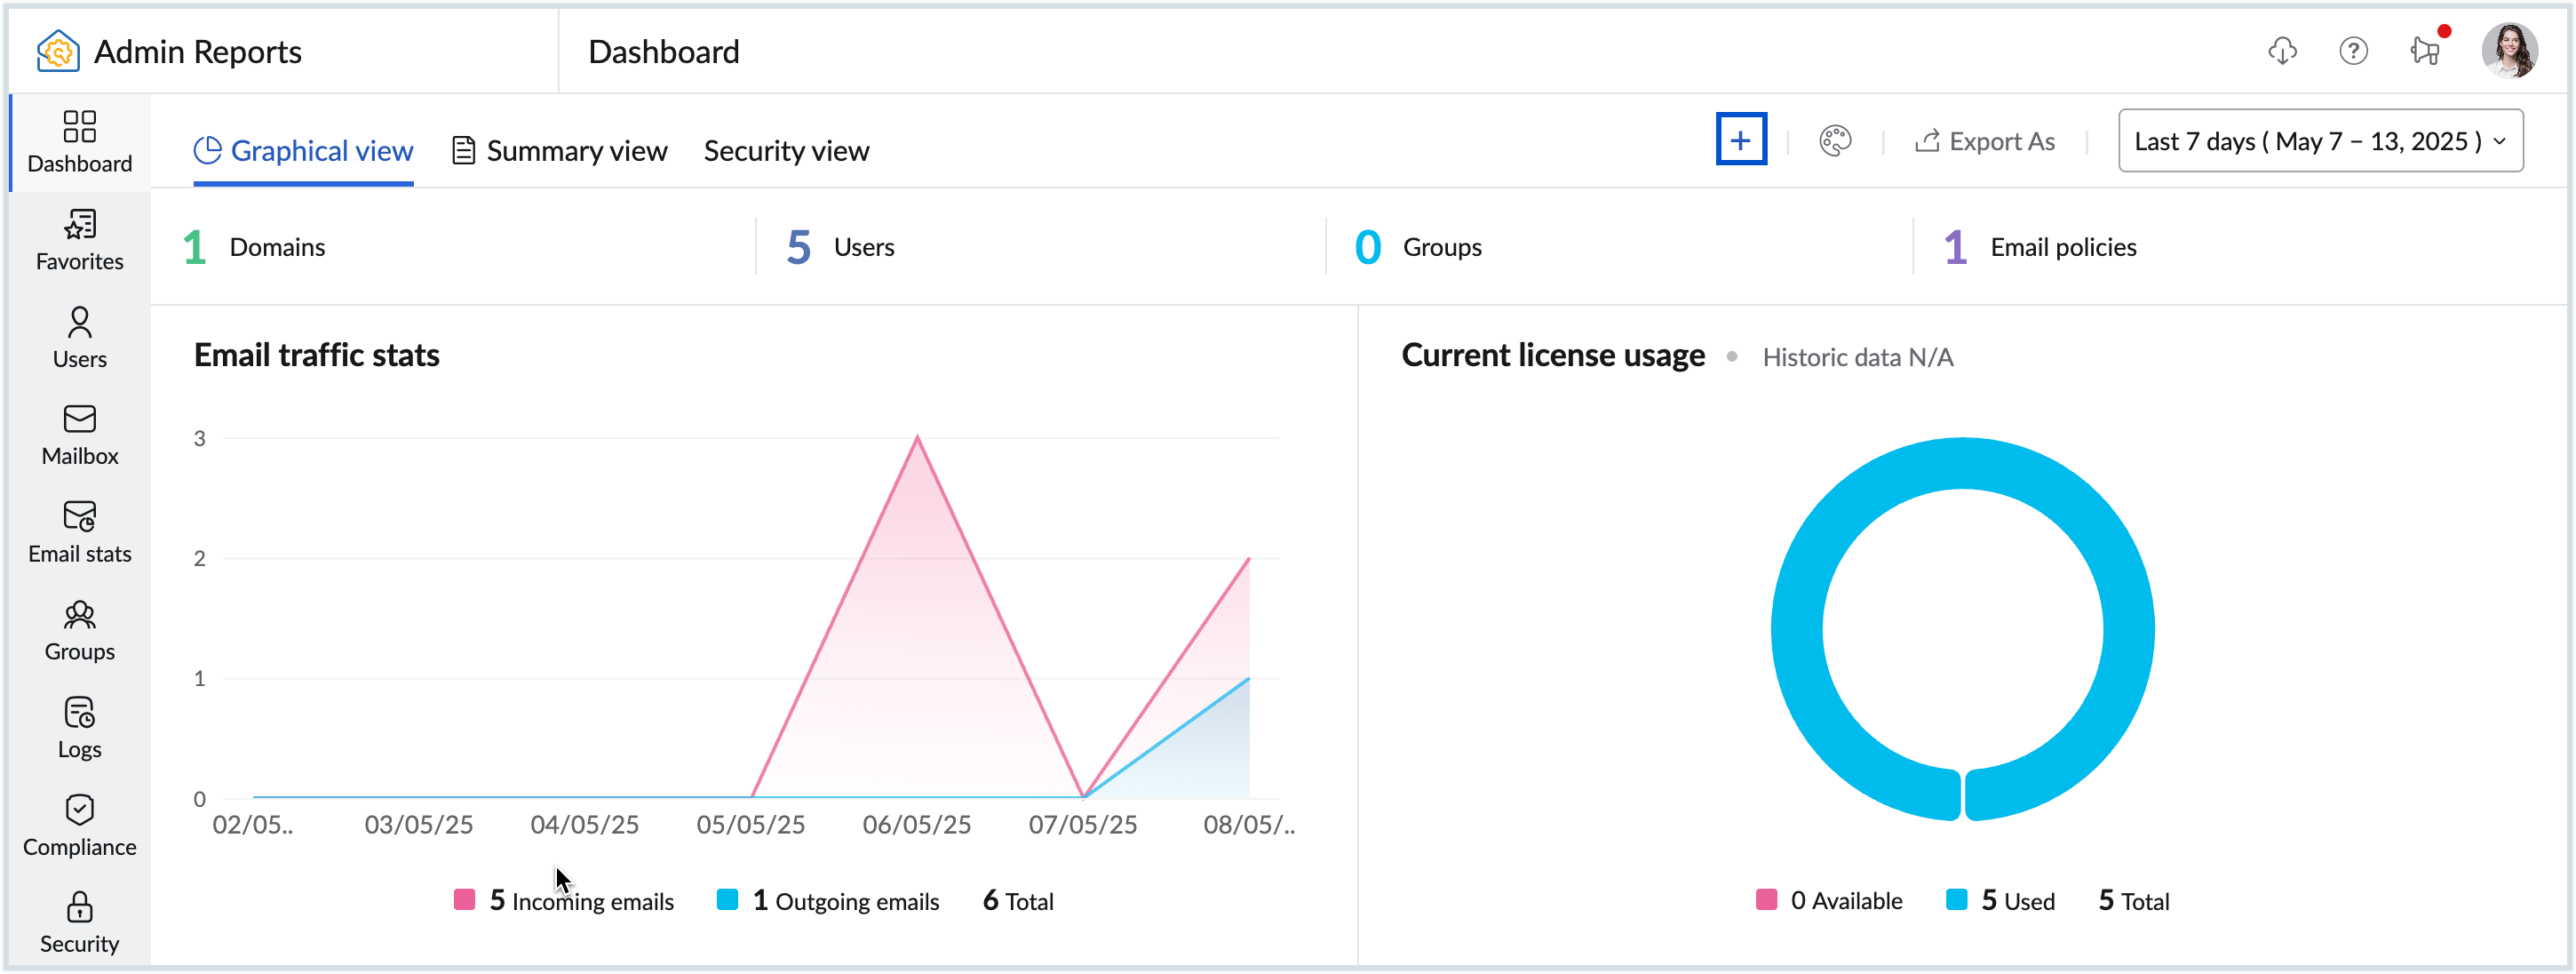
The Dashboard section in Admin Reports serves as the gateway you need to assess all the statistical data pertinent to your organization. The Reports Dashboard allows administrators to get a holistic view of various key metrics, such as email traffic, user activity, and the security status of the email, all in one place.
The Admin Reports Dashboard offers various views, including the default dashboard views, Graphical view, Summary view, Security view, or Custom dashboard, where you can create your own dashboard. Each dashboard comprises various reports as widgets, such as Security score, Email traffic stats, and User summary, etc.
Note:
The Summary view , Security view, and Custom dashboard options are available only for organizations that use one of our paid plans.
Graphical View
The Graphical View Dashboard offers a visual chart-like representation of various important metrics and aspects of your organization's email usage, performance, and resource utilization. Additionally, you can choose a dashboard theme color, which helps in differentiating between different data points within the reports.
To view the Graphical View Dashboard and enable or disable widgets:
- Log in to Zoho Mail Admin Console.
- On the left pane, click on the Reports section.
- In the Admin Reports Dashboard that appears, select Graphical View dashboard the top pane. Below is a list of default widgets available in Graphical view:
- Email traffic stats - Provides a visual representation of the number of incoming and outgoing emails.
- Current license usage - View your organization's license count, the number of used licenses and the number of available licenses through this widget.
- Email size(KB) - Depicts the size of incoming and outgoing emails.
- User summary - Lists the number of Active, Inactive and Admin users.
- Bounce reports - Displays the total number of emails sent and the number of emails that got bounced.
- Rejection reports - Shows the total emails received and the number of emails that got rejected.
- Outgoing traffic - Displays the number of emails sent within the organization and the number of emails sent to external email addresses.
- Incoming traffic - Number of emails received within the organization and the number of emails received from external email addresses.
- Authentication reports - A graphical representation of Spam reports. It differentiates the number of failures based on DKIM, SPF, and SPF Soft fail.
- Spam reports - Displays the total number of incoming emails (including those received in groups) versus the number of Spam emails.
- Rejection type reports - A chart-type report which shows the cause of rejection such as Malicious attachment, Virus, DNSBL, and PBL.
- Quarantine incoming reports - Lists the number of emails received in Quarantine versus the number of emails Delivered, Denied, or Redelivered.
- DMARC incoming reports - Displays the incoming DMARC traffic reports of your organization.
- WorkDrive storage - For organizations that use WorkDrive, this report will be enabled.
- File activity - A funnel-type chart report shows the number of files created, uploaded, downloaded, previewed, and updated in your organization.
- Security score - A chart-type report which displays your organization's security score, providing insights into overall security posture.
- Booking rate by capacity - Displays the percentage of hours that the rooms of different sizes were booked.
- Booking rate by time - Displays the percentage of rooms were booked at different time.
- Estimated occupancy rate by capacity - Displays how full rooms of different sizes were while in use.
- Booking rate - Displays the percentage of working hours that the rooms were booked.
- Click on the Date filter dropdown and select the desired time period to access reports for specific timelines or intervals.
- Click the Dashboard Theme icon and select the theme color of your choice from the list.
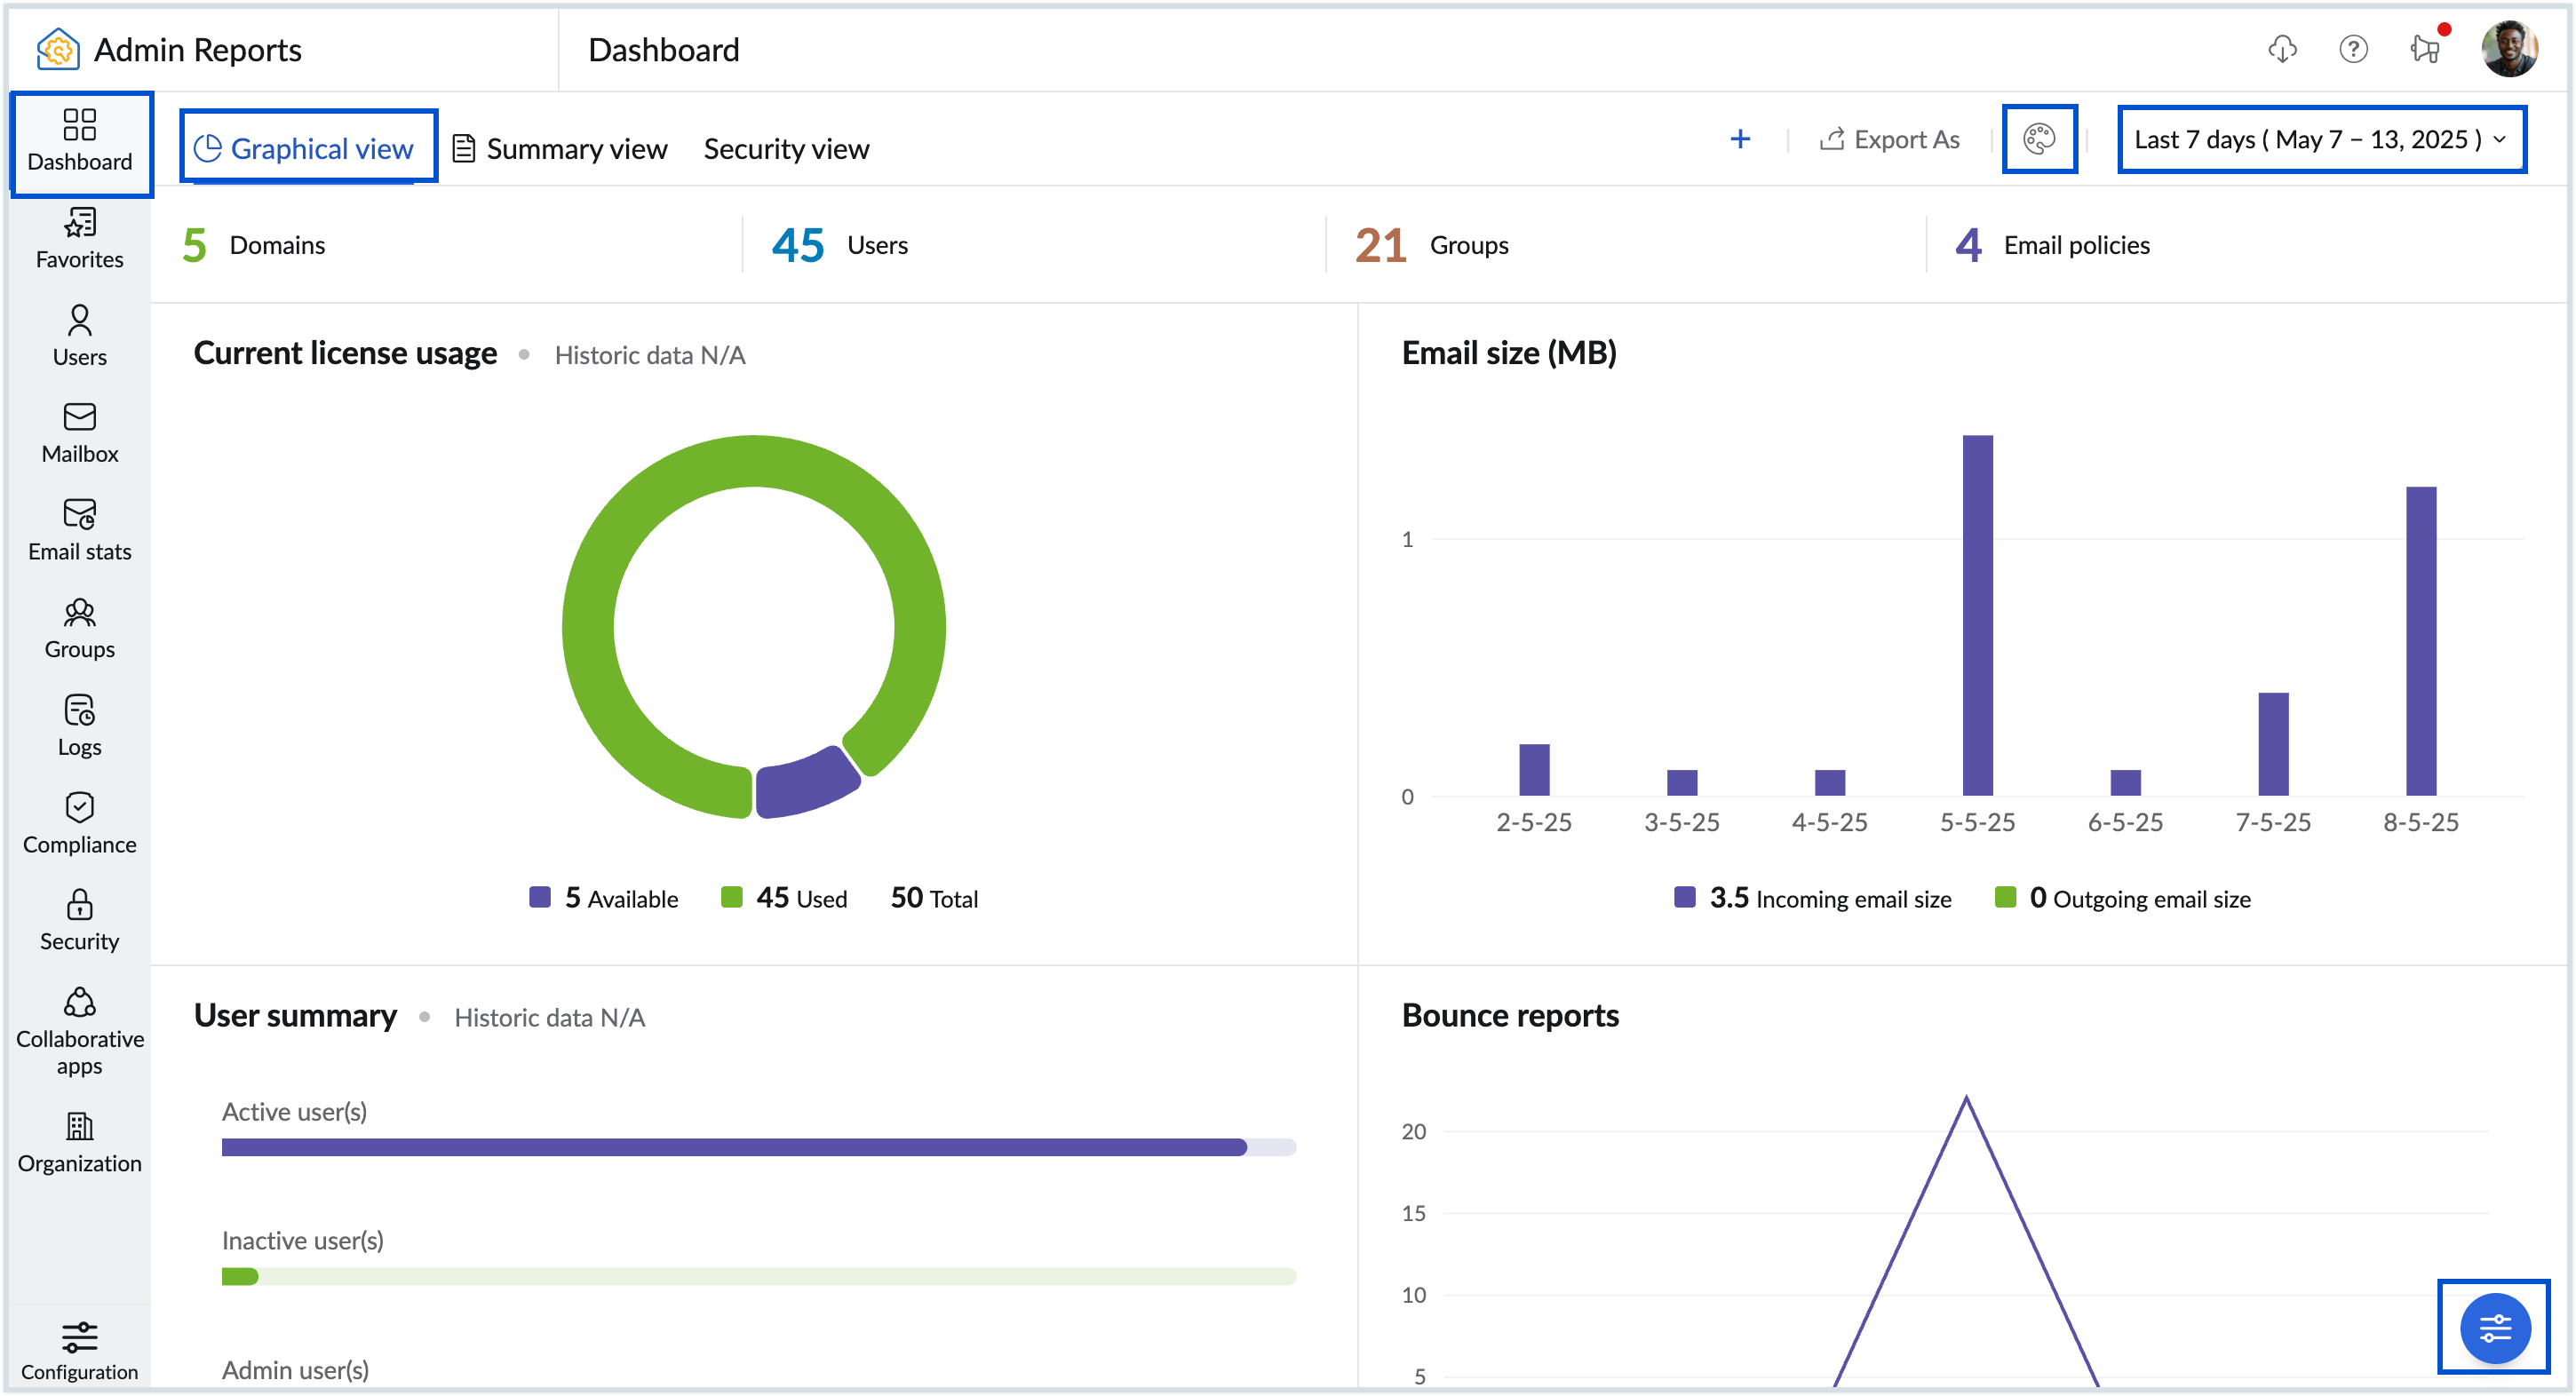
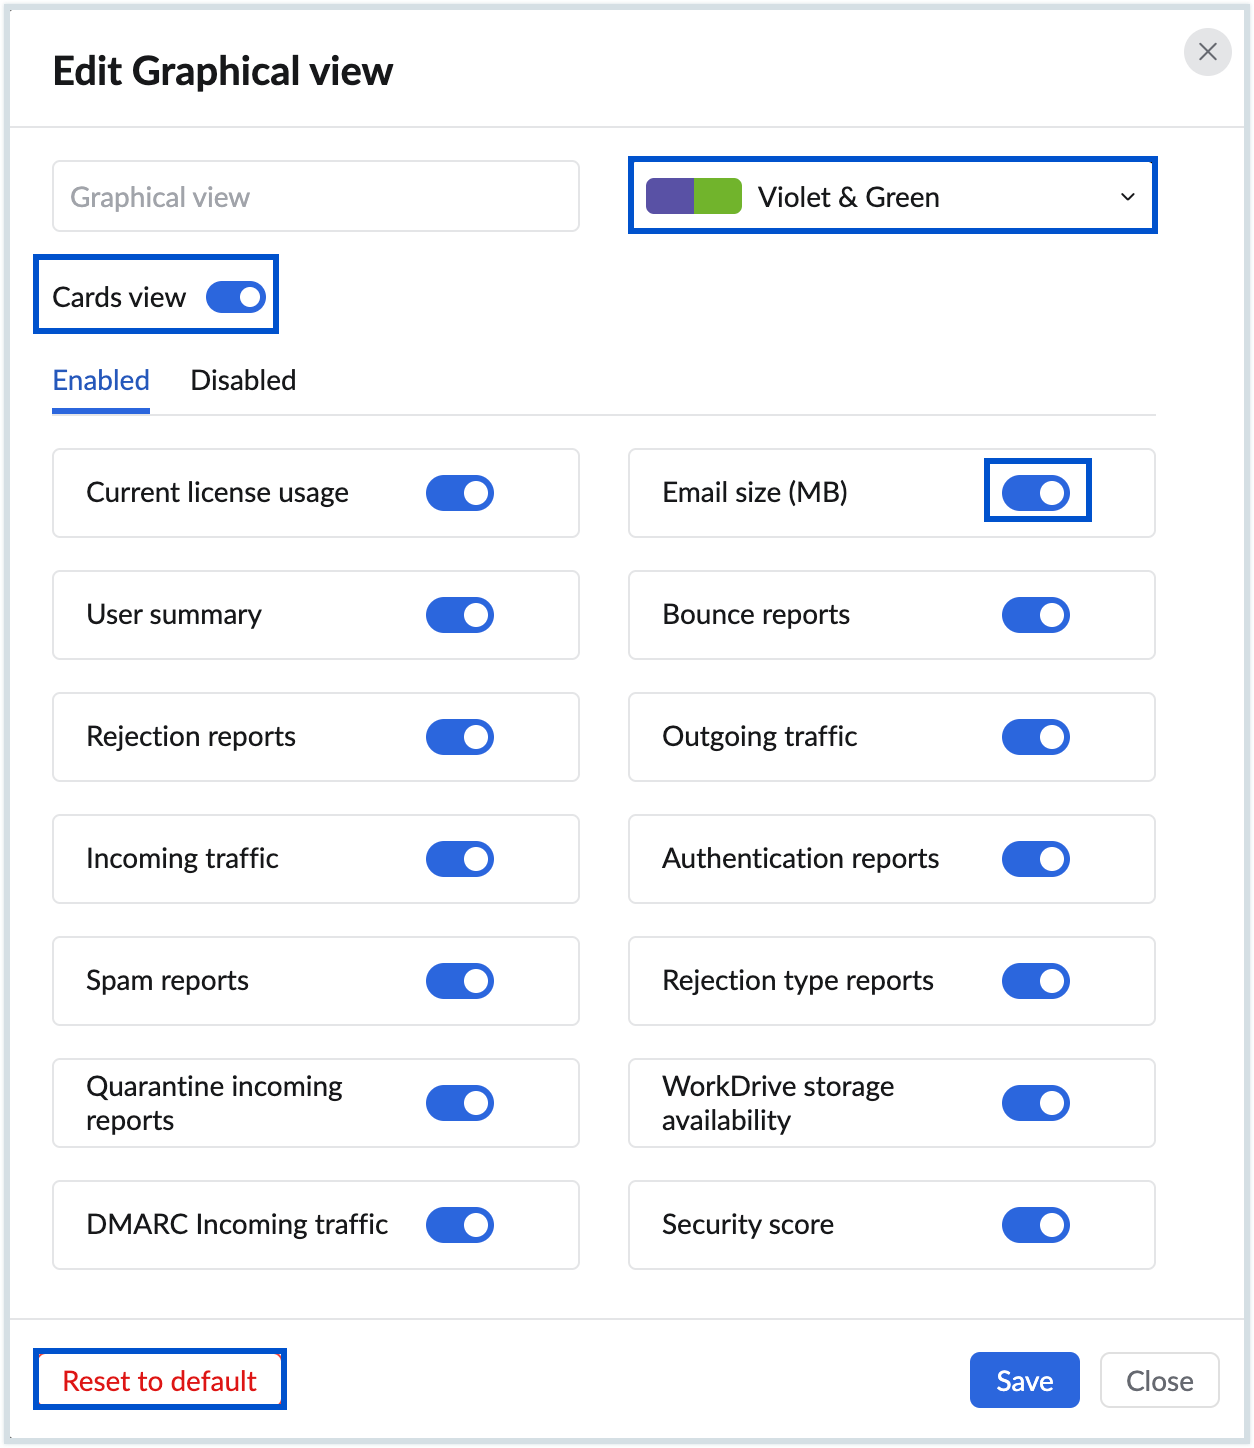
- Click the Customize Graphical view dashboard icon to view the following options:
- Select the theme colour of your choice for the dashboard.
- Enable or disable Cards view using the toggle button.
- Navigate between the Enabled and Disabled tabs, to enable or disable a widget based on your requirement.
- You can reorganize the widgets by dragging and dropping them into your preferred position or by using the increment and decrement options to set their priority. For example, if you enter 1 in the priority field for the Outgoing traffic widget, it will appear as the first widget on the dashboard.
- Click the Reset to default button to reset the dashboard back to its default settings, or click Save to apply your changes.
- To share dashboard data, click the Share icon in the top pane. You can save the file to your device in CSV or PDF format using the Save to device option, or share it directly via Send via Cliq or Add to WorkDrive. For more details, refer to the Share Dashboard section below.
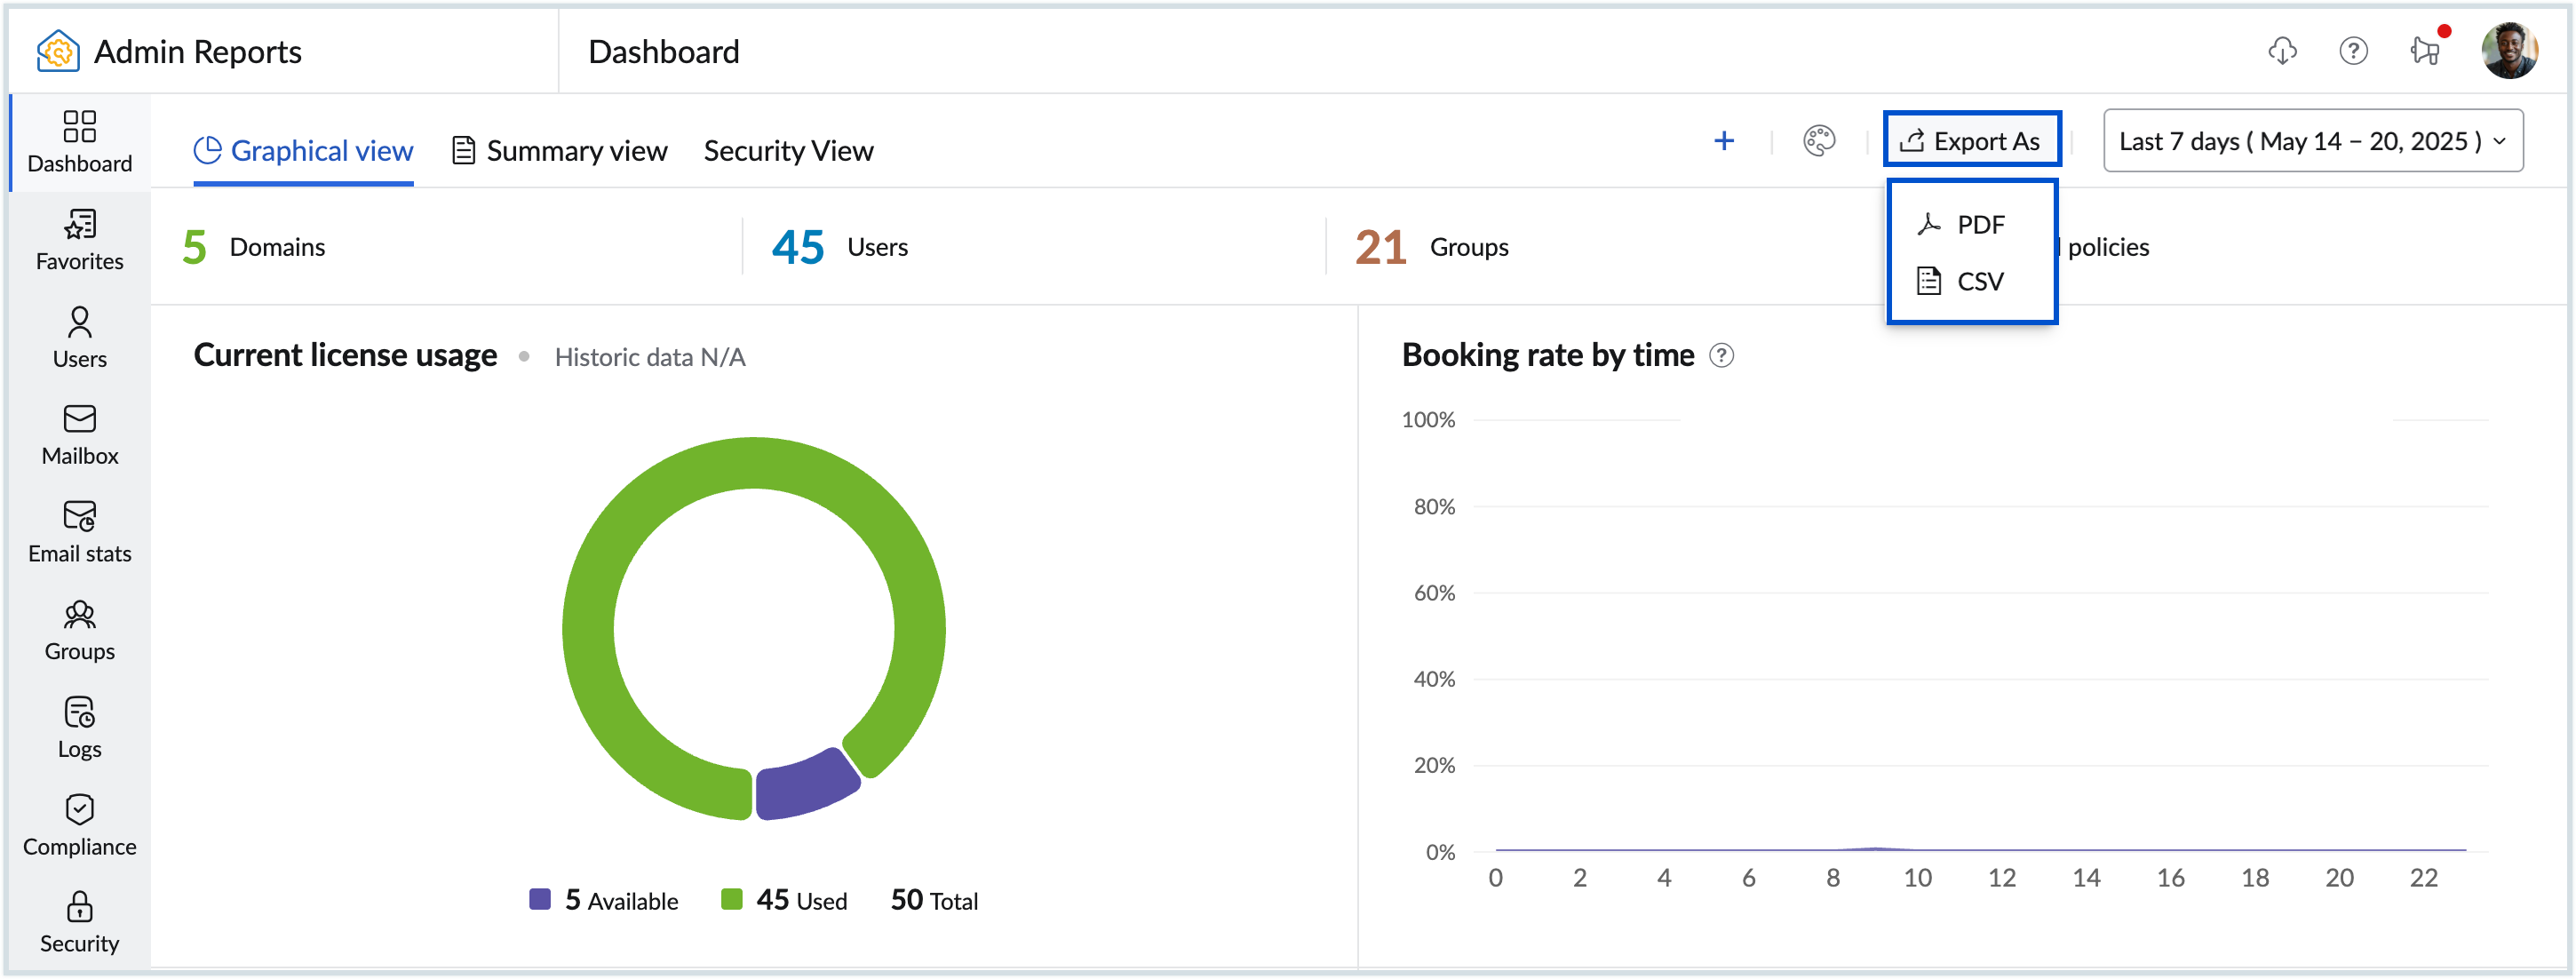
You can also add your preferred report onto the graphical view dashboard, in addition to the default widgets provided, using Custom Widgets.
Summary View
The Summary View dashboard offers a comprehensive summary of diverse statistical data essential for maintaining organizational efficiency or resolving pending tasks.
To view the Summary View Dashboard and enable or disable widgets:
- Log in to Zoho Mail Admin Console.
- On the left pane, click on the Reports section.
In the Admin Reports Dashboard that appears, select Summary View dashboard the top pane. Below is a list of default widgets available in Summary view:
- Groups awaiting moderation - Displays the groups that require moderation along with the number of emails awaiting administrator action. Clicking on the email count redirects you to the group Moderation page.
- Groups with most members - Shows the groups that have the most number of users. Clicking on the member count redirects you to the respective Groups page.
- Administrators - Lists the number of Super Admin, Admin, and Custom Admins available in your organization.
- Recently created users - Lists the number of new users created recently. Click on the user count to view the users created.
- Recently deleted users - Number of users deleted recently.
- Users nearing storage limit - Displays the users with the highest storage consumption in descending order. Clicking on the storage value redirects you to the Admin Console's Storage page. The color of the storage percentage changes automatically based on the usage threshold. Refer to the table below for the corresponding colors, thresholds, and status levels.
Storage Usage Indicators Color Threshold Status Red Above 80% Critical Orange Above 60% High Green Below 60% Medium - Dormant users - Lists the number of inactive users in your organization.
- Blocked users - Displays the list of blocked users in your organization.
- Blocked groups - Displays the list of blocked groups in your organization.
- Click the Dashboard Theme icon and select the theme color of your choice from the list.
- Hover over the widgets to drag and drop them into your preferred order from dashboard view itself.
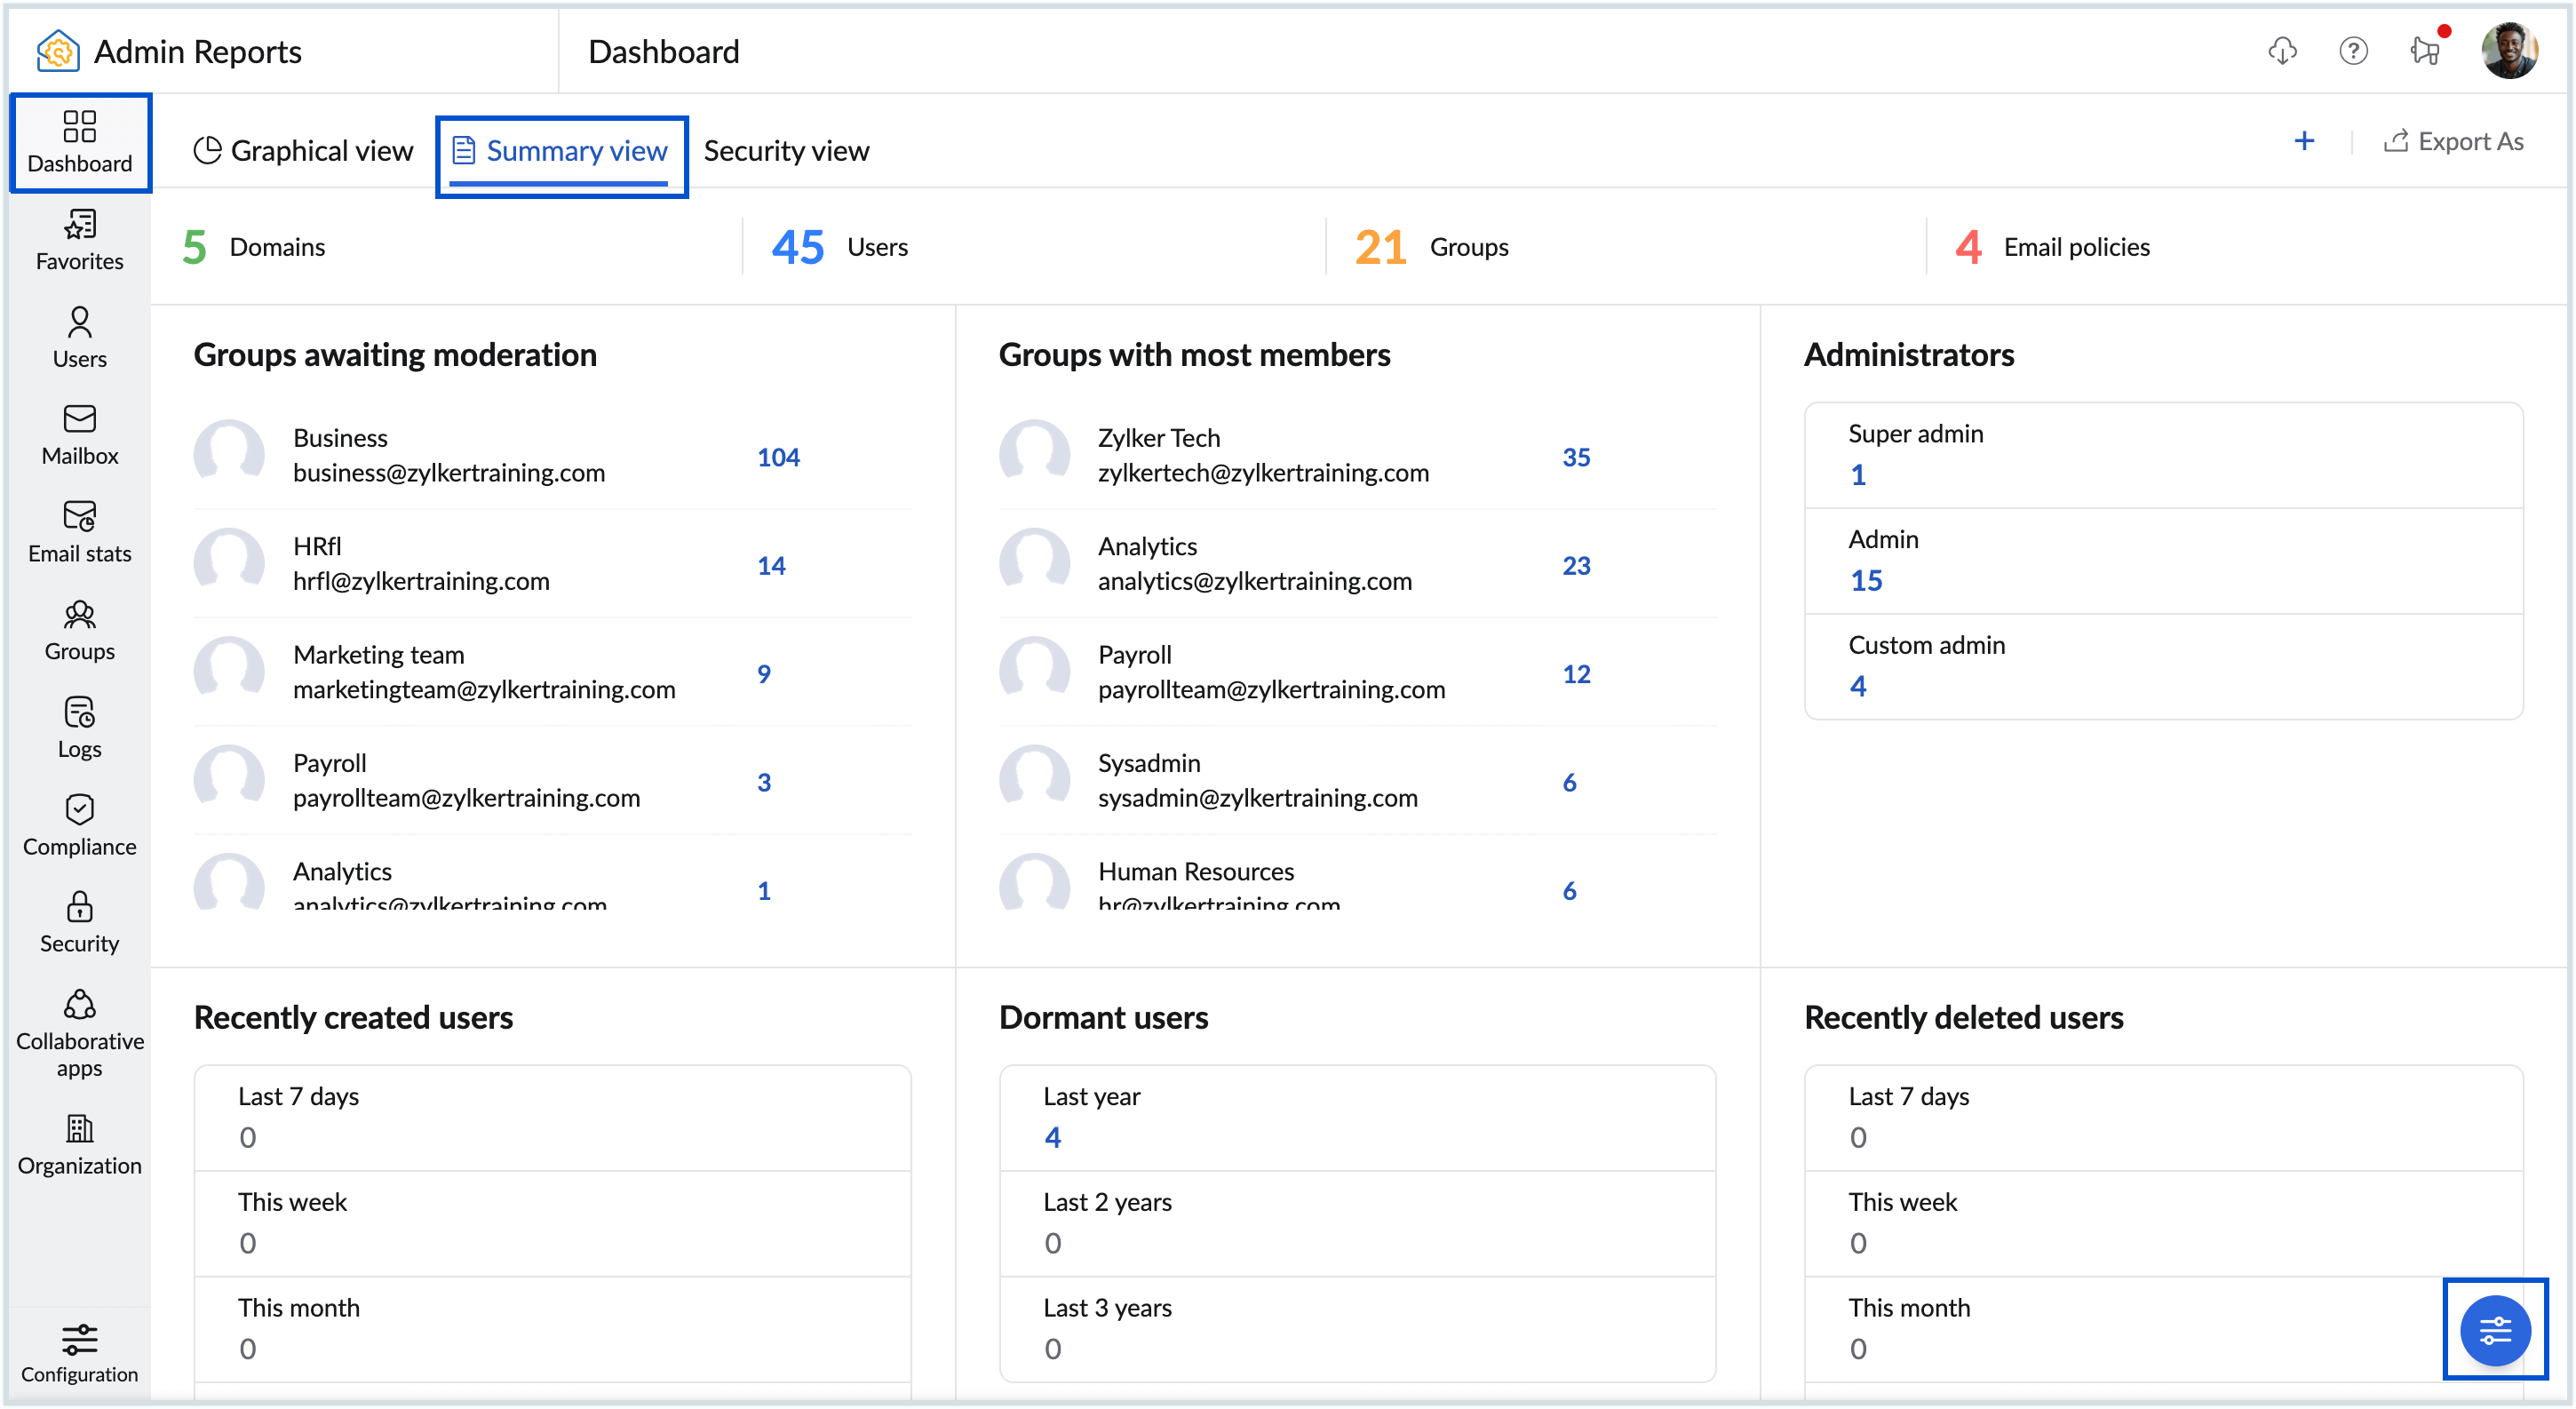
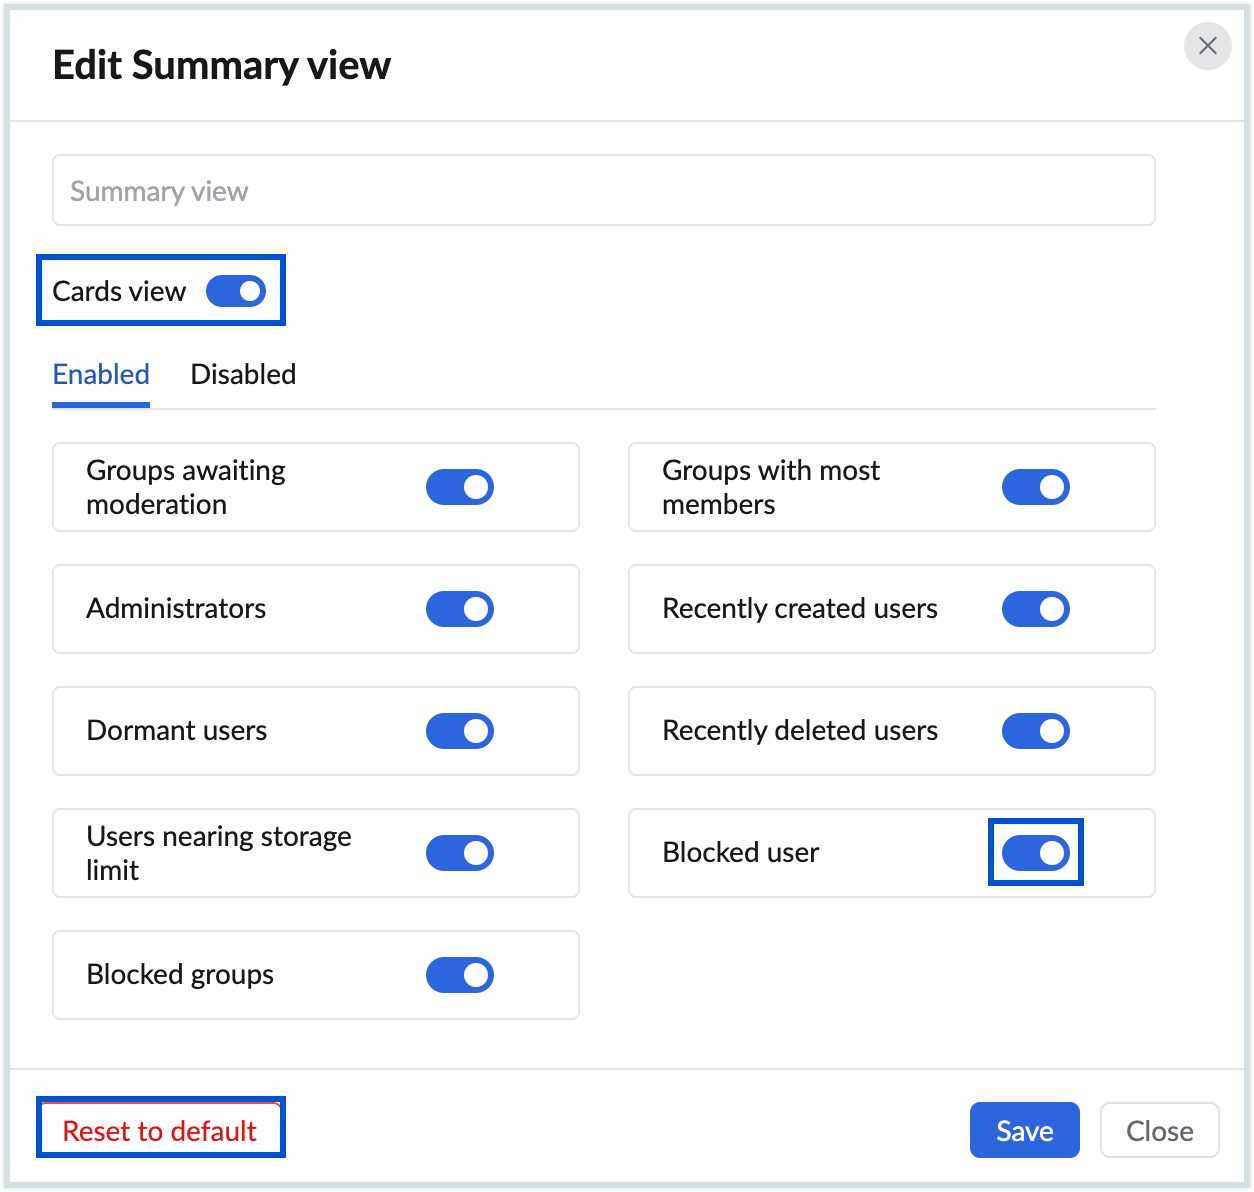
- Click the Customize Summary view dashboard icon to customize the dashboard:
- Select the theme colour of your choice for the dashboard.
- Enable or disable Cards view using the toggle button.
- Navigate between the Enabled and Disabled tabs to enable or disable a widget based on your requirement
- You can reorganize the widgets by dragging and dropping them into your preferred position or by using the increment and decrement options to set their priority.
- Click the Reset to default button to revert the dashboard to its original settings, or click Save to apply your changes.
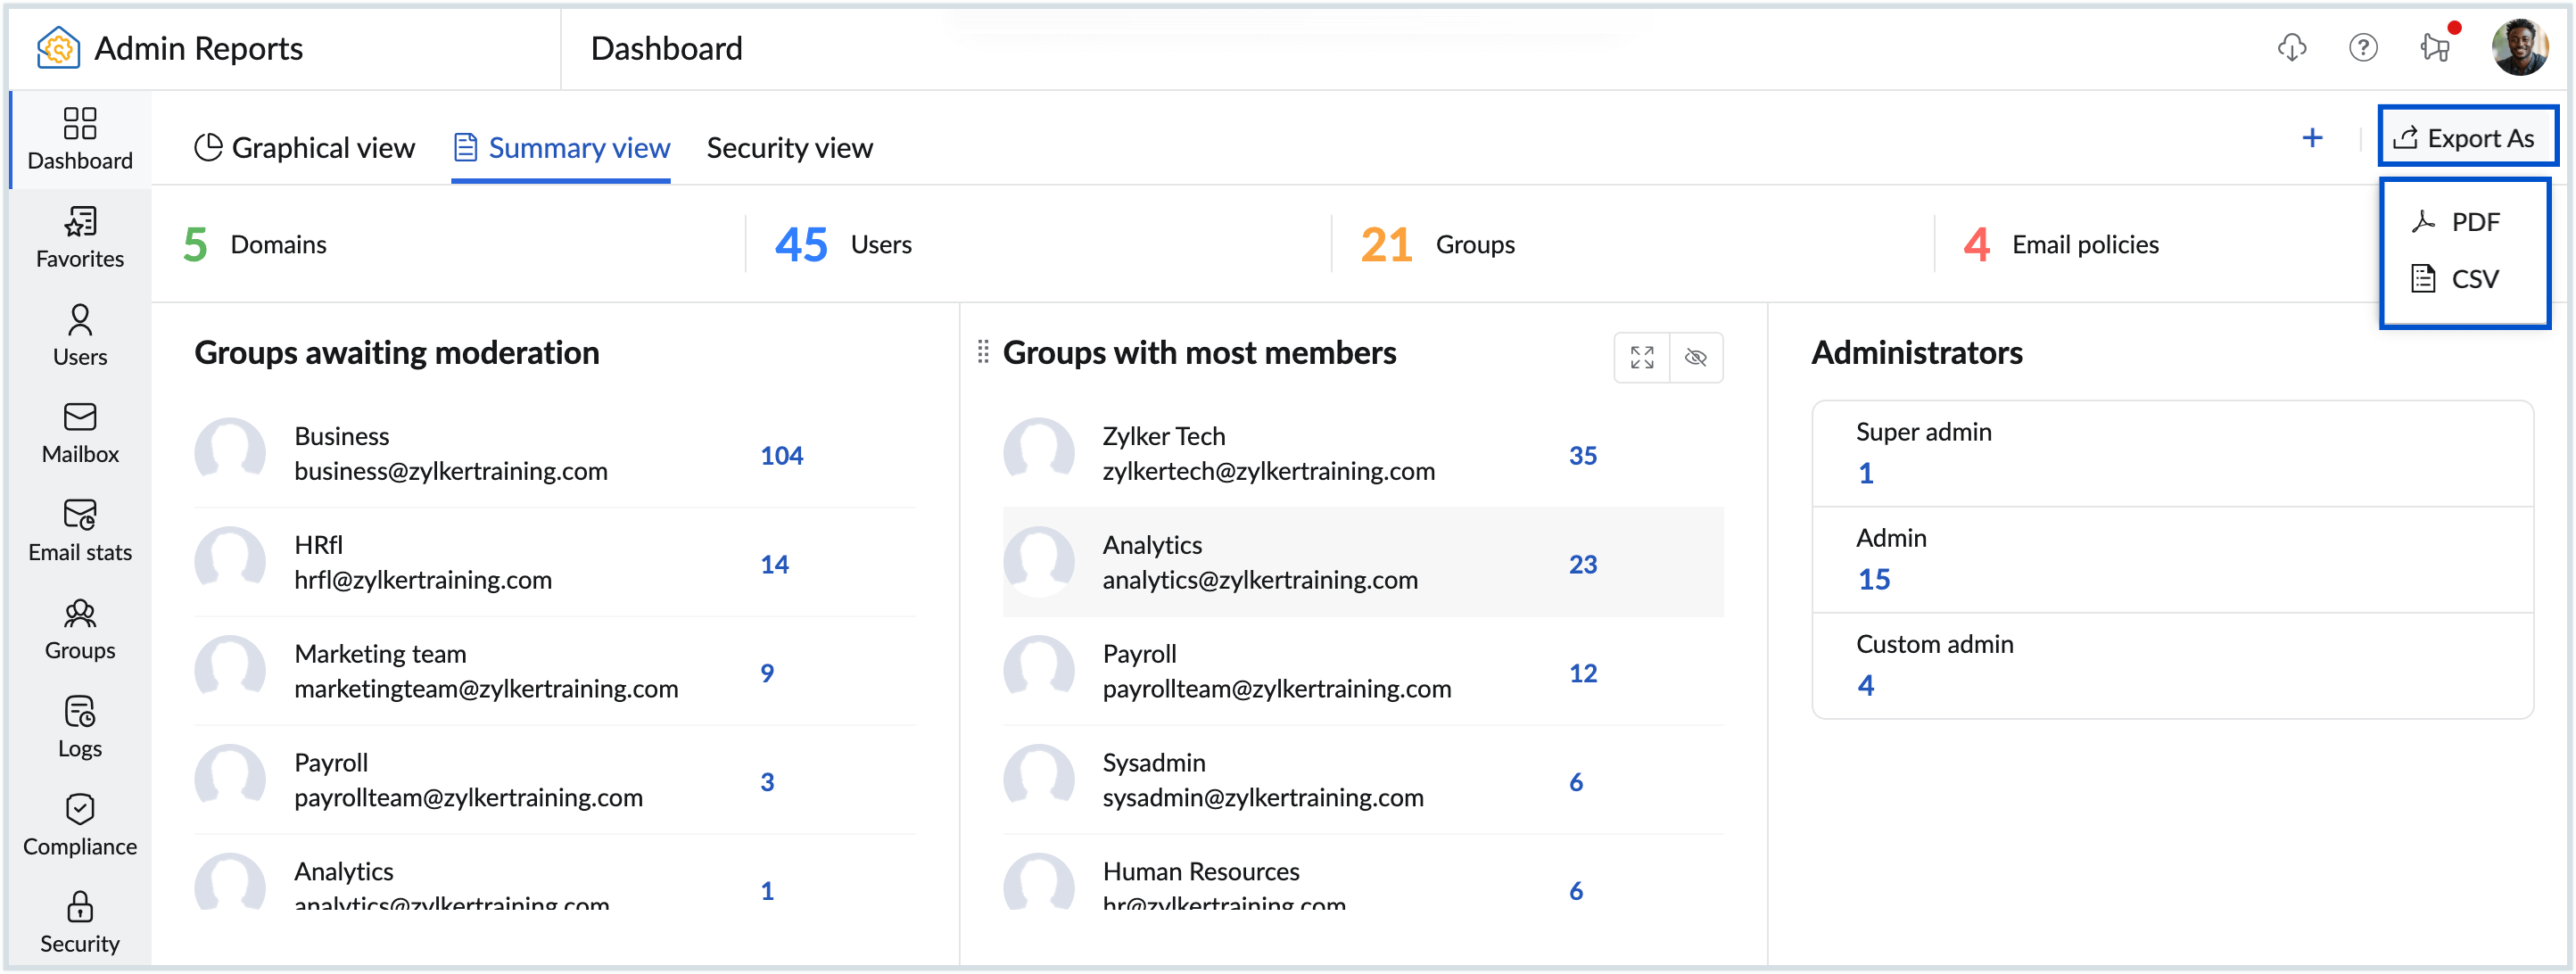
- To share dashboard data, click the Share icon in the top pane. You can save the file to your device in CSV or PDF format using the Save to device option, or share it directly via Send via Cliq or Add to WorkDrive. For more details, refer to the Share Dashboard section below.
Note:
The Summary view option is available only for organizations that use one of our paid plans.
Security View
The Security View Dashboard is specifically curated to focus on security-related metrics and insights. Unlike the Graphical and Summary views, all the widgets present in the security dashboard can be modified, allowing you to tailor it to your unique security monitoring requirements. 
To customize the security view dashboard, click the Customize Security view dashboard button at the bottom of the dashboard. Customize the widgets according to your preferences by dragging and dropping them into your preferred position or by using the increment and decrement options to set their priority and click Save. 
To delete the entire dashboard, select Delete Dashboard and confirm the action by clicking Delete in the confirmation pop-up.
To share dashboard data, click the Share icon in the top pane. You can save the file to your device in CSV or PDF format using the Save to device option, or share it directly via Send via Cliq or Add to WorkDrive. For more details, refer to the Share Dashboard section below.
Custom Dashboard
In addition to the default dashboard views provided in Admin Reports, you can also create your own Custom Dashboards by selecting preferred widgets from the available reports, that cater to their unique reporting requirements. Whether it's monitoring email traffic, tracking user activity, or analyzing security data, you can combine multiple reports to visualize data in a way that enhances decision-making and facilitates efficient management of email operations.
To create a custom dashboard, follow the below steps:
- Log in to Zoho Mail Admin Console.
- On the left pane, click on the Reports section. The Admin Reports will open in a new tab.
- In the Admin Reports Dashboard that appears, select the Plus icon in the top pane.
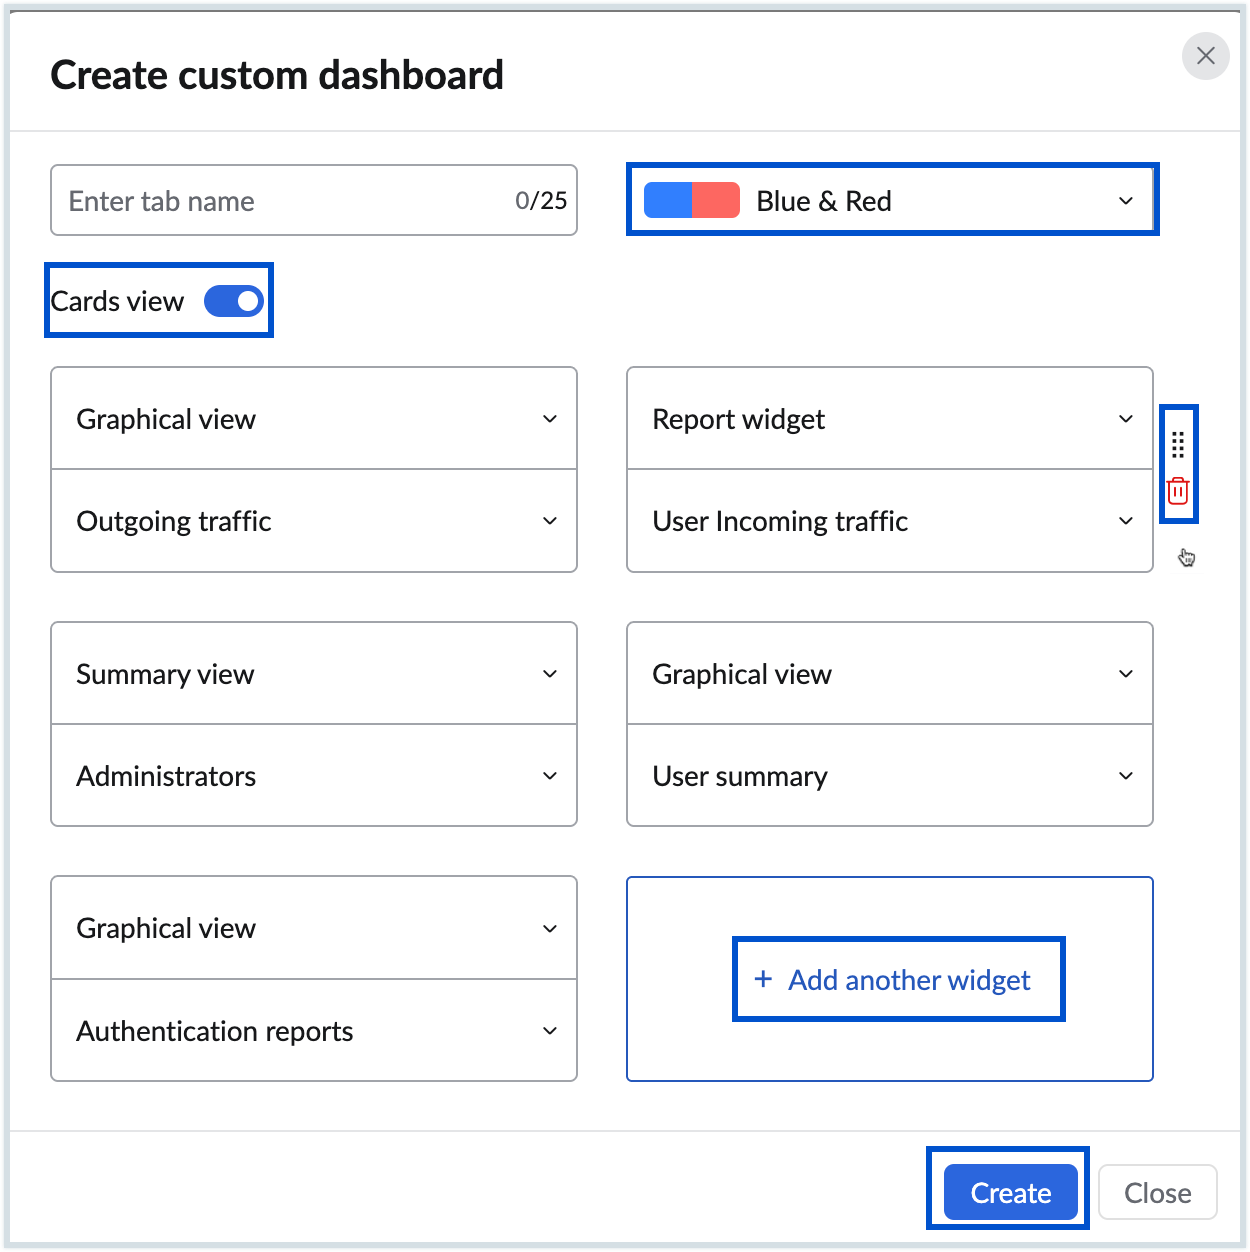
- Enter a Name for the dashboard.
- Choose a Dashboard theme of your choice.
- Select whether you want to Enable cards view for the dashboard.
- Select the View and the respective Widgets from the drop down in the Add Widget section.
- Click the Add another widget button to add multiple widgets.
- Hover over the widget to rearrange or delete it using the Drag and drop and Delete icons, respectively.
- Once you have finished creating your dashboard, click on the Create button.
The created custom dashboard will be added to your Admin Reports Dashboard. To modify your custom dashboard, select the Customize dashboard button at the bottom of the dashboard. Here, you can modify or rearrange the report widgets by dragging and dropping them into your preferred position or by using the increment and decrement options to set their priority and click Save. To delete the whole dashboard, click the Delete dashboard button and confirm the action by clicking Delete in the confirmation pop-up.
Note:
The Custom Dashboard option is available only for organizations that use one of our paid plans.
Custom Widgets
In addition to the default widgets, you can also add custom widgets to your dashboard. Custom widgets can be added only for reports that are represented as a chart. Do these steps to add a custom widget:
- Log in to Zoho Mail Admin Console.
- On the left pane, click on the Reports section. The Admin Reports will open in a new tab.
- Navigate to the preferred report type in the left pane that you want to add as a custom widget.
- Click the Add to button from the top right of the toolbar.
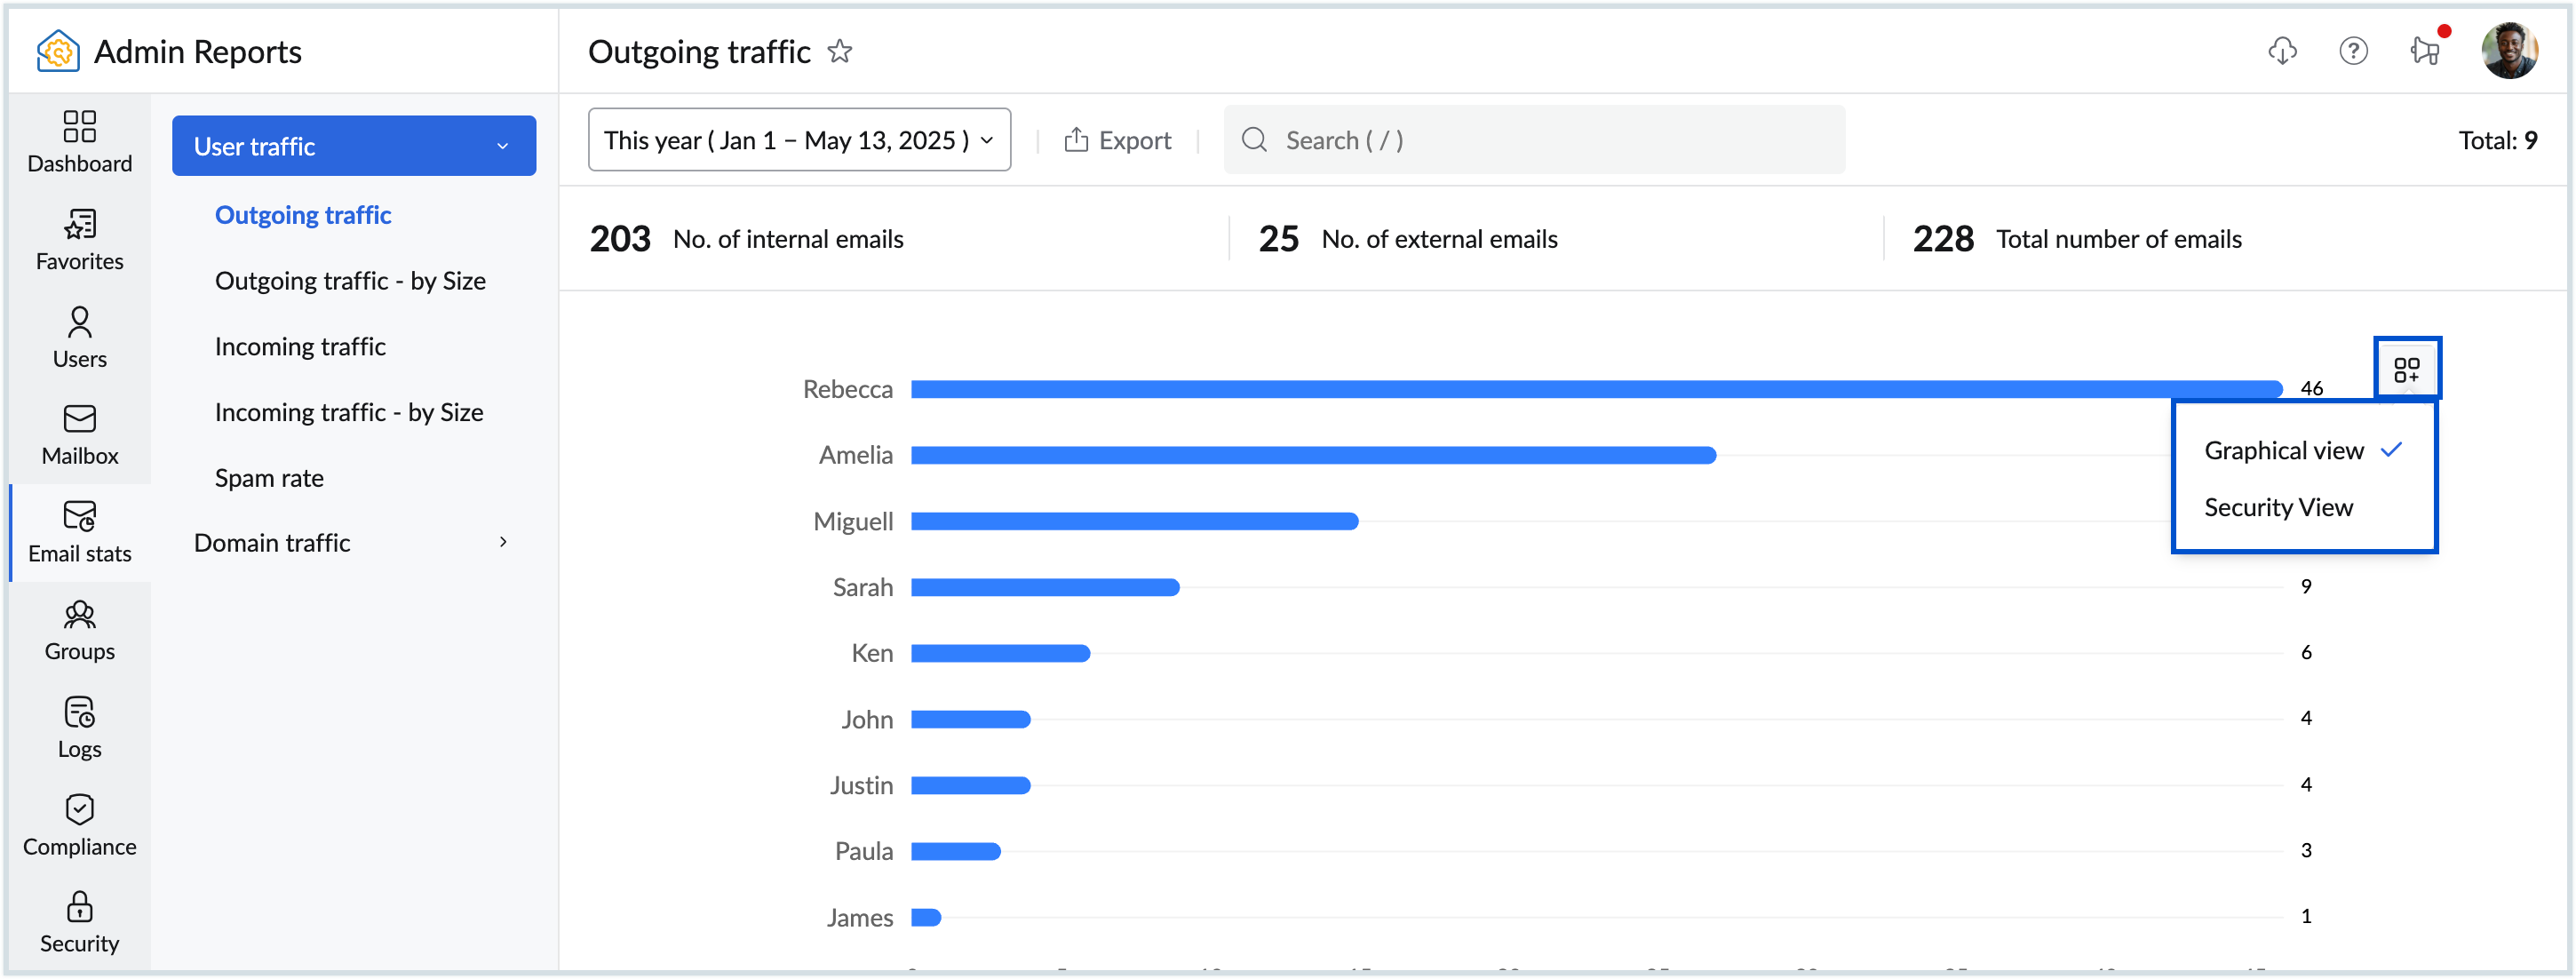
- Select the Dashboard to which to want to add the widget.
- You can also remove a added custom widget from the dashboard by doing the same.
To remove the added custom widget from the dashboard view, navigate to the custom widget that was added and click the Remove button. Additionally, you can remove it from the Customize dashboard section on the respective dashboard.
Note:
This option is available only for organizations that use one of our paid plans.
Widget Actions
The Admin Reports Dashboard provides multiple dashboard views, and each dashboard consists of various reports presented as widgets. Each widget visually represents key metrics through different chart types, including pie, table, area, bar, line, and stacked bar charts. In addition to dashboards, individual reports within Admin Reports also feature graphical representations.
Widgets not only display statistical insights but also offer actions like Show Reports, Change Chart Type, Share, Expand, and Hide. The list of actions can be seen at the top right corner of each widget, and may vary depending on the widget type.
| Widget Action | Description |
| Show reports | Redirects to the respective reports page. |
| Chart type | Allows you to switch between the available chart types (area, bar, line, stacked bar). The chart type option is not available for all reports. |
| Share | Enables downloading the widget in SVG, PNG, or JPEG format or sharing it via email, Zoho Cliq, or Zoho WorkDrive. This is different from the Export and Share Reports feature. Refer to the Export and Share reports section for more details.. |
| Expand | Displays the selected widget in a maximized view to provide a more closer look. From the expanded view, you can navigate between the various widgets by using the arrow keys in the keyboard or by selecting the desired widget report from the drop-down in the top left corner. You can Close or Share the report by clicking on the respective icon from the top right corner. |
| Hide | Hide/ disable a particular widget from the dashboard. To enable it again, you must click the Customize organization dashboard. Note: This option is available only for organizations that use one of our paid plans. |
Favorites
Zoho Mail Admin Reports section contains numerous reports to analyse your organization's data. As an admin, it might be difficult to navigate between these sections daily to check your regular reports and also each admin may have different requirements. Using the Favorites section, each admin can choose to keep all their favorite reports in one place instead of juggling between different sections for easy access.
Note:
This option is available only for organizations that use one of our paid plans.
To add any report under Favourites, follow these steps:
- Log in to Zoho Mail Admin Console and select Reports on the left pane. The Admin Reports page opens in a new tab.
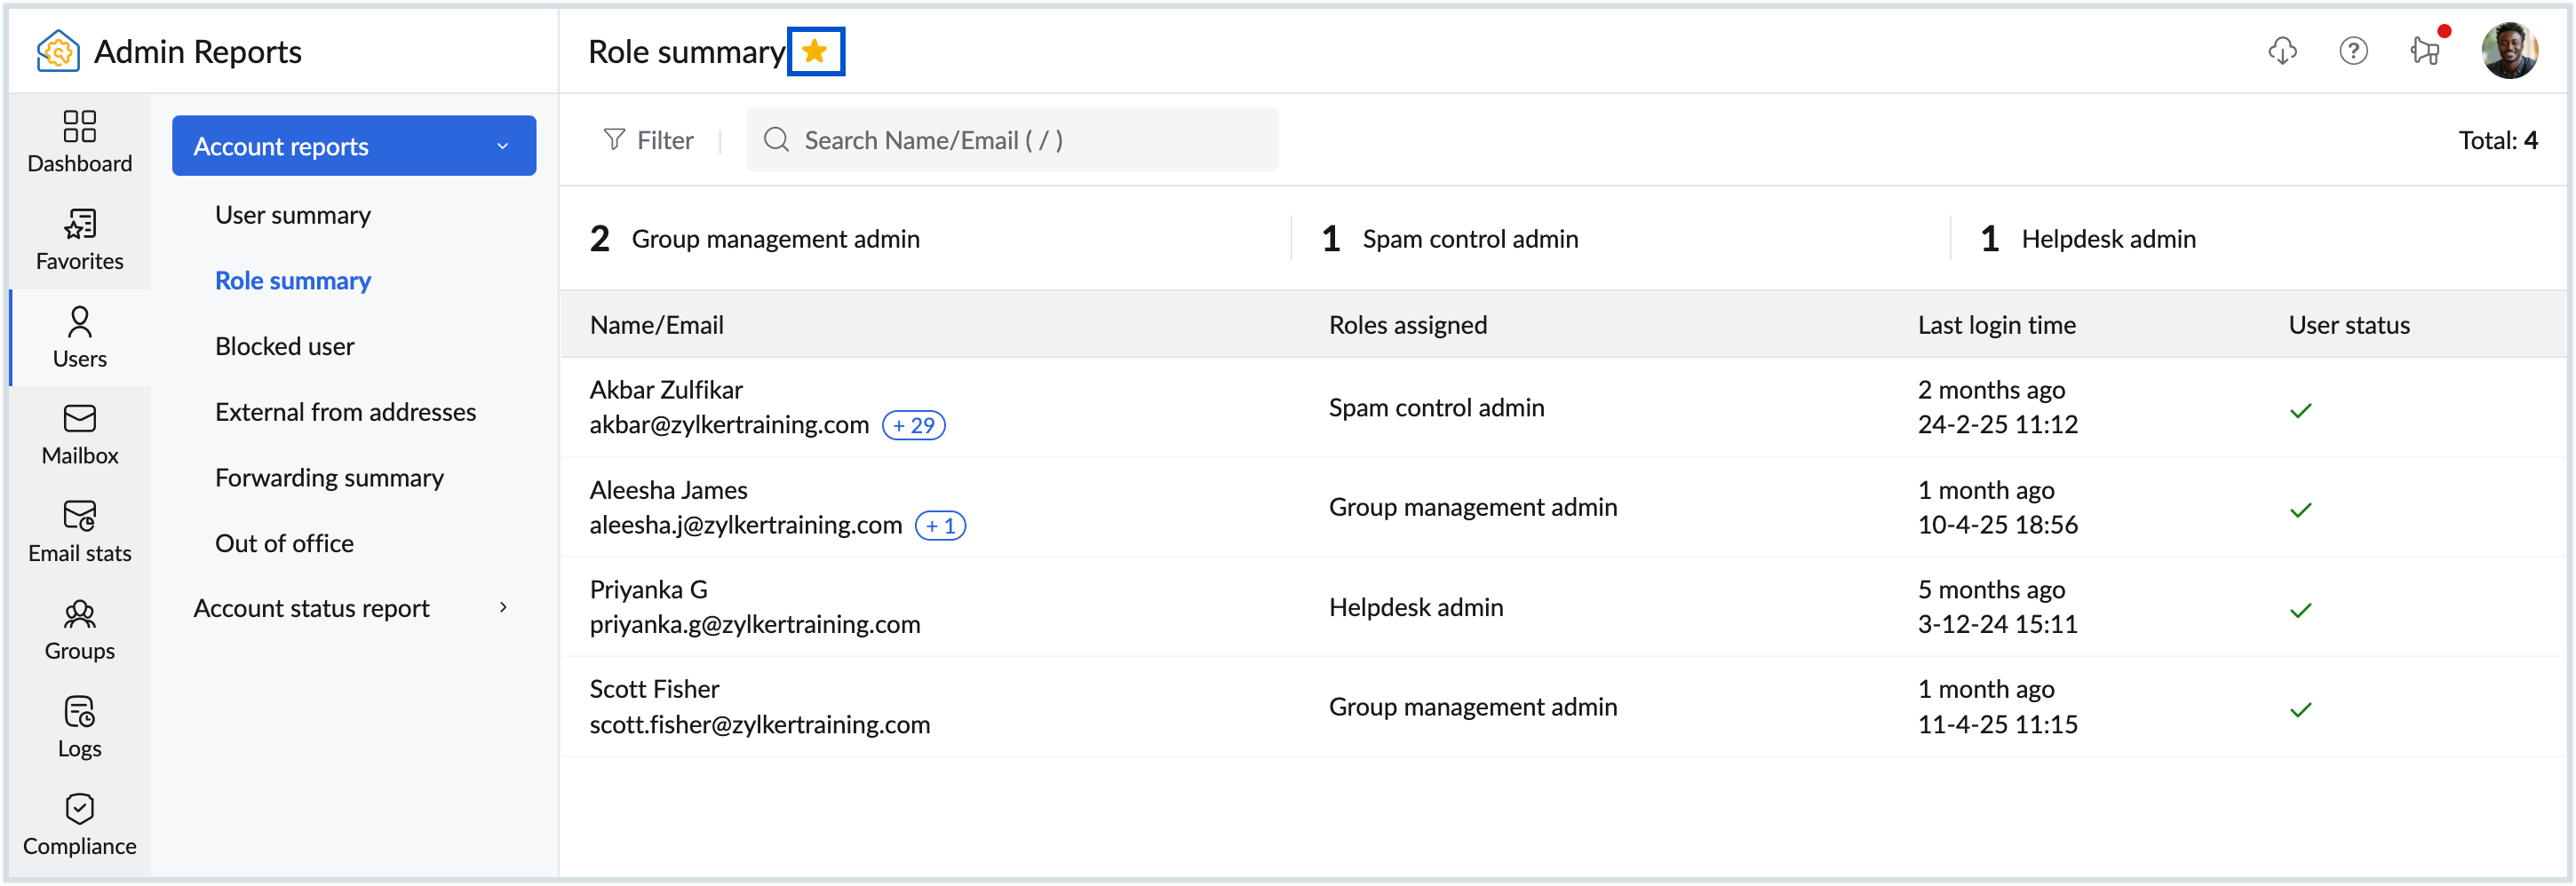
- Select the report which you want to add to Favourites and click the Star icon next to the report name in the top panel and the respective report gets added to the Favorites.
- Navigate to the Favorites section from the left pane.
- Click on the drop-down and select the necessary report from the list of all the reports added as favorites.

- You can uncheck the star icon anytime either from the Favorites section or in the respective report section to remove any report from favorites.
Available Reports
You can view and manage various organization reports from the left pane of your Admin Reports. To learn more about each report, click on the report type from the below list:
- User account reports
- Mailbox reports
- Email stats
- Groups
- Compliance reports
- Security reports
- Logs
- WorkDrive
- Organization reports
Export and Share Reports
Zoho Mail Admin Reports offer several options for exporting and sharing your organization's reports data. You can download reports to your local device or share them directly via email, Zoho Cliq, or Zoho WorkDrive.
Note:
The sharing options within Admin Reports may vary based on the Mail or Workplace plan you've subscribed to.
Download Reports
To download reports, follow the below steps:
- Log in to Zoho Mail Admin Console.
- On the left pane, click on the Reports section.
- Navigate to the report or hover over the chart that you want to share.
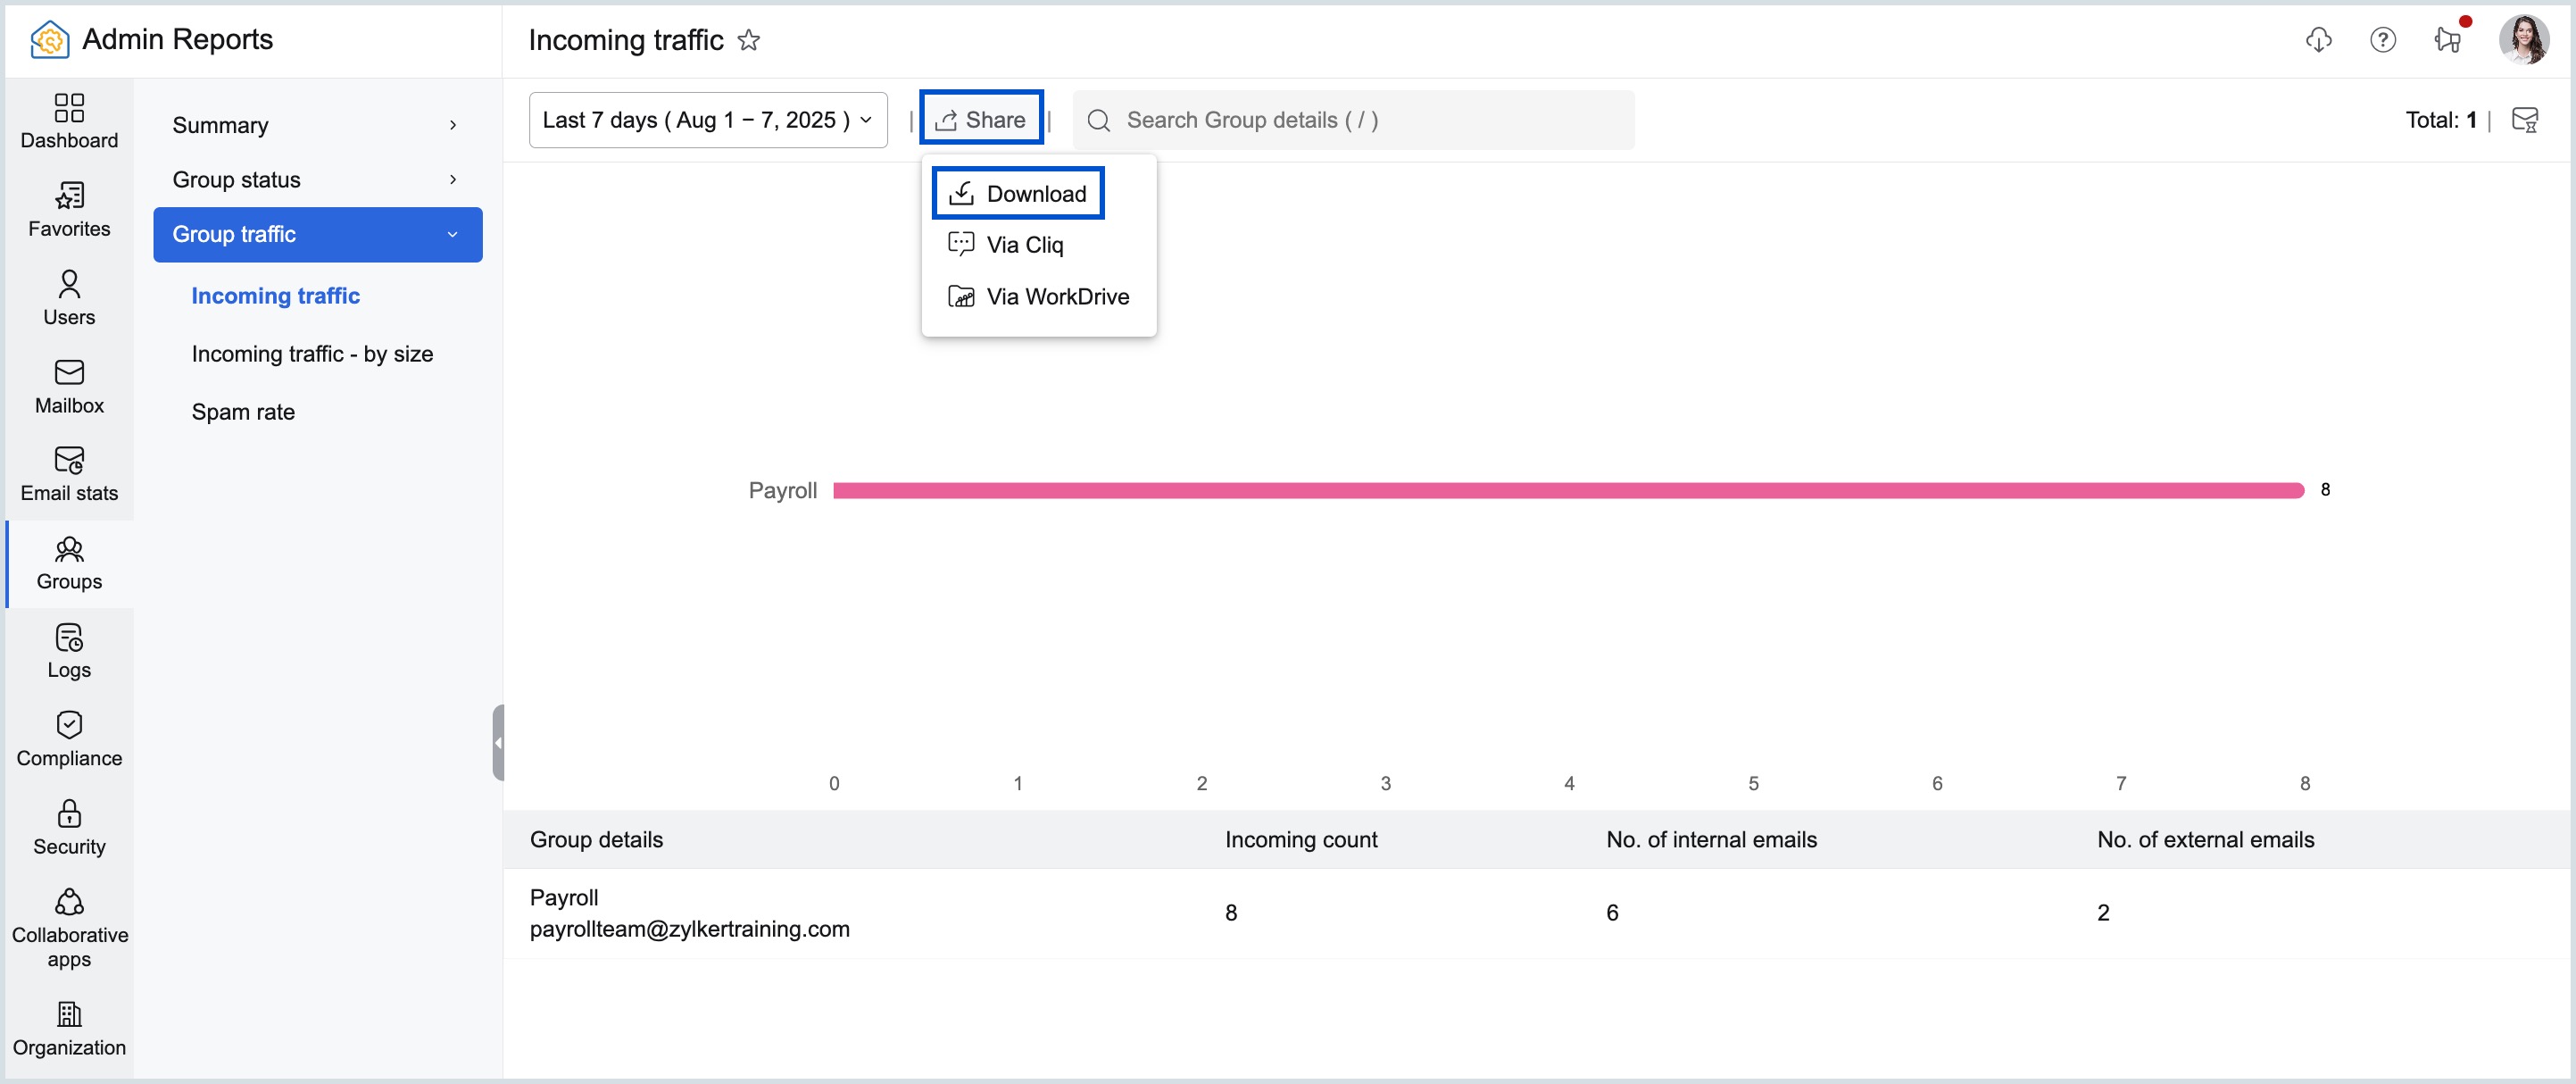
- Click the Share button and select Download.
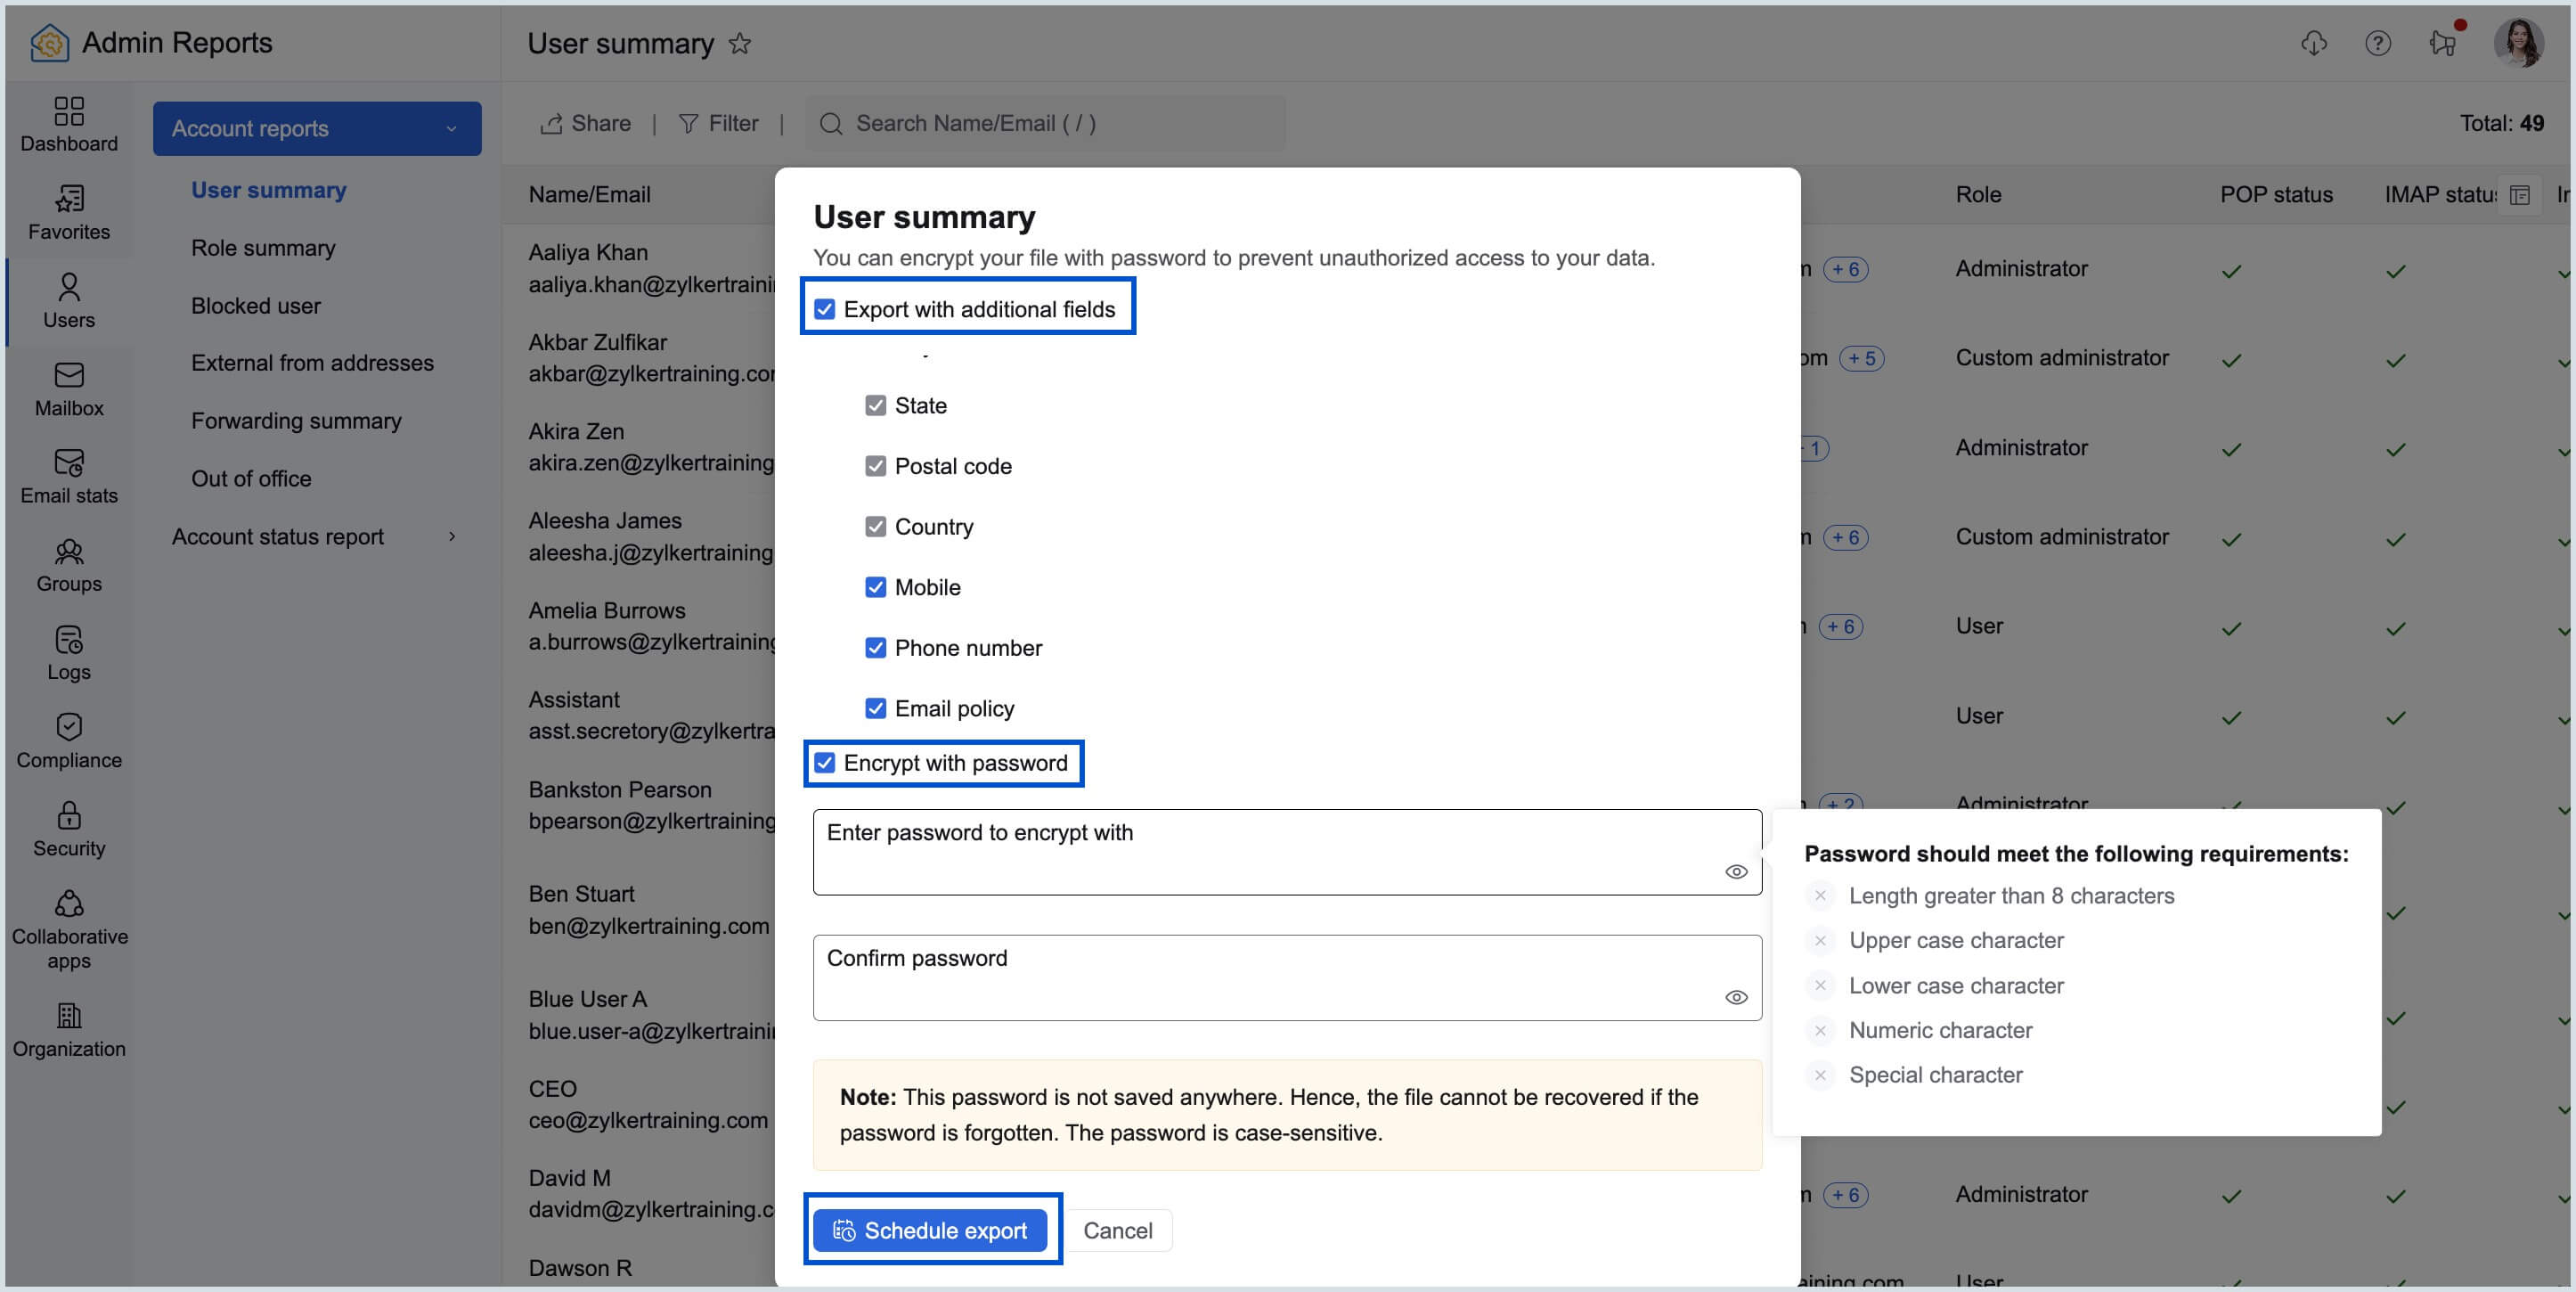
- If applicable, you can encrypt the file or apply other export conditions as required.
- Once done, click Schedule export. Your exported data will be saved to your local device.
Note:
If you choose to download a report that requires time to generate the data file, the export process will be scheduled. You can track these reports in the Scheduled exports section to check their status and download them once they are ready.
Share via email
To share a report through email, follow these steps:
- Log in to Zoho Mail Admin Console.
- On the left pane, click on the Reports section and navigate to the report you want to share.
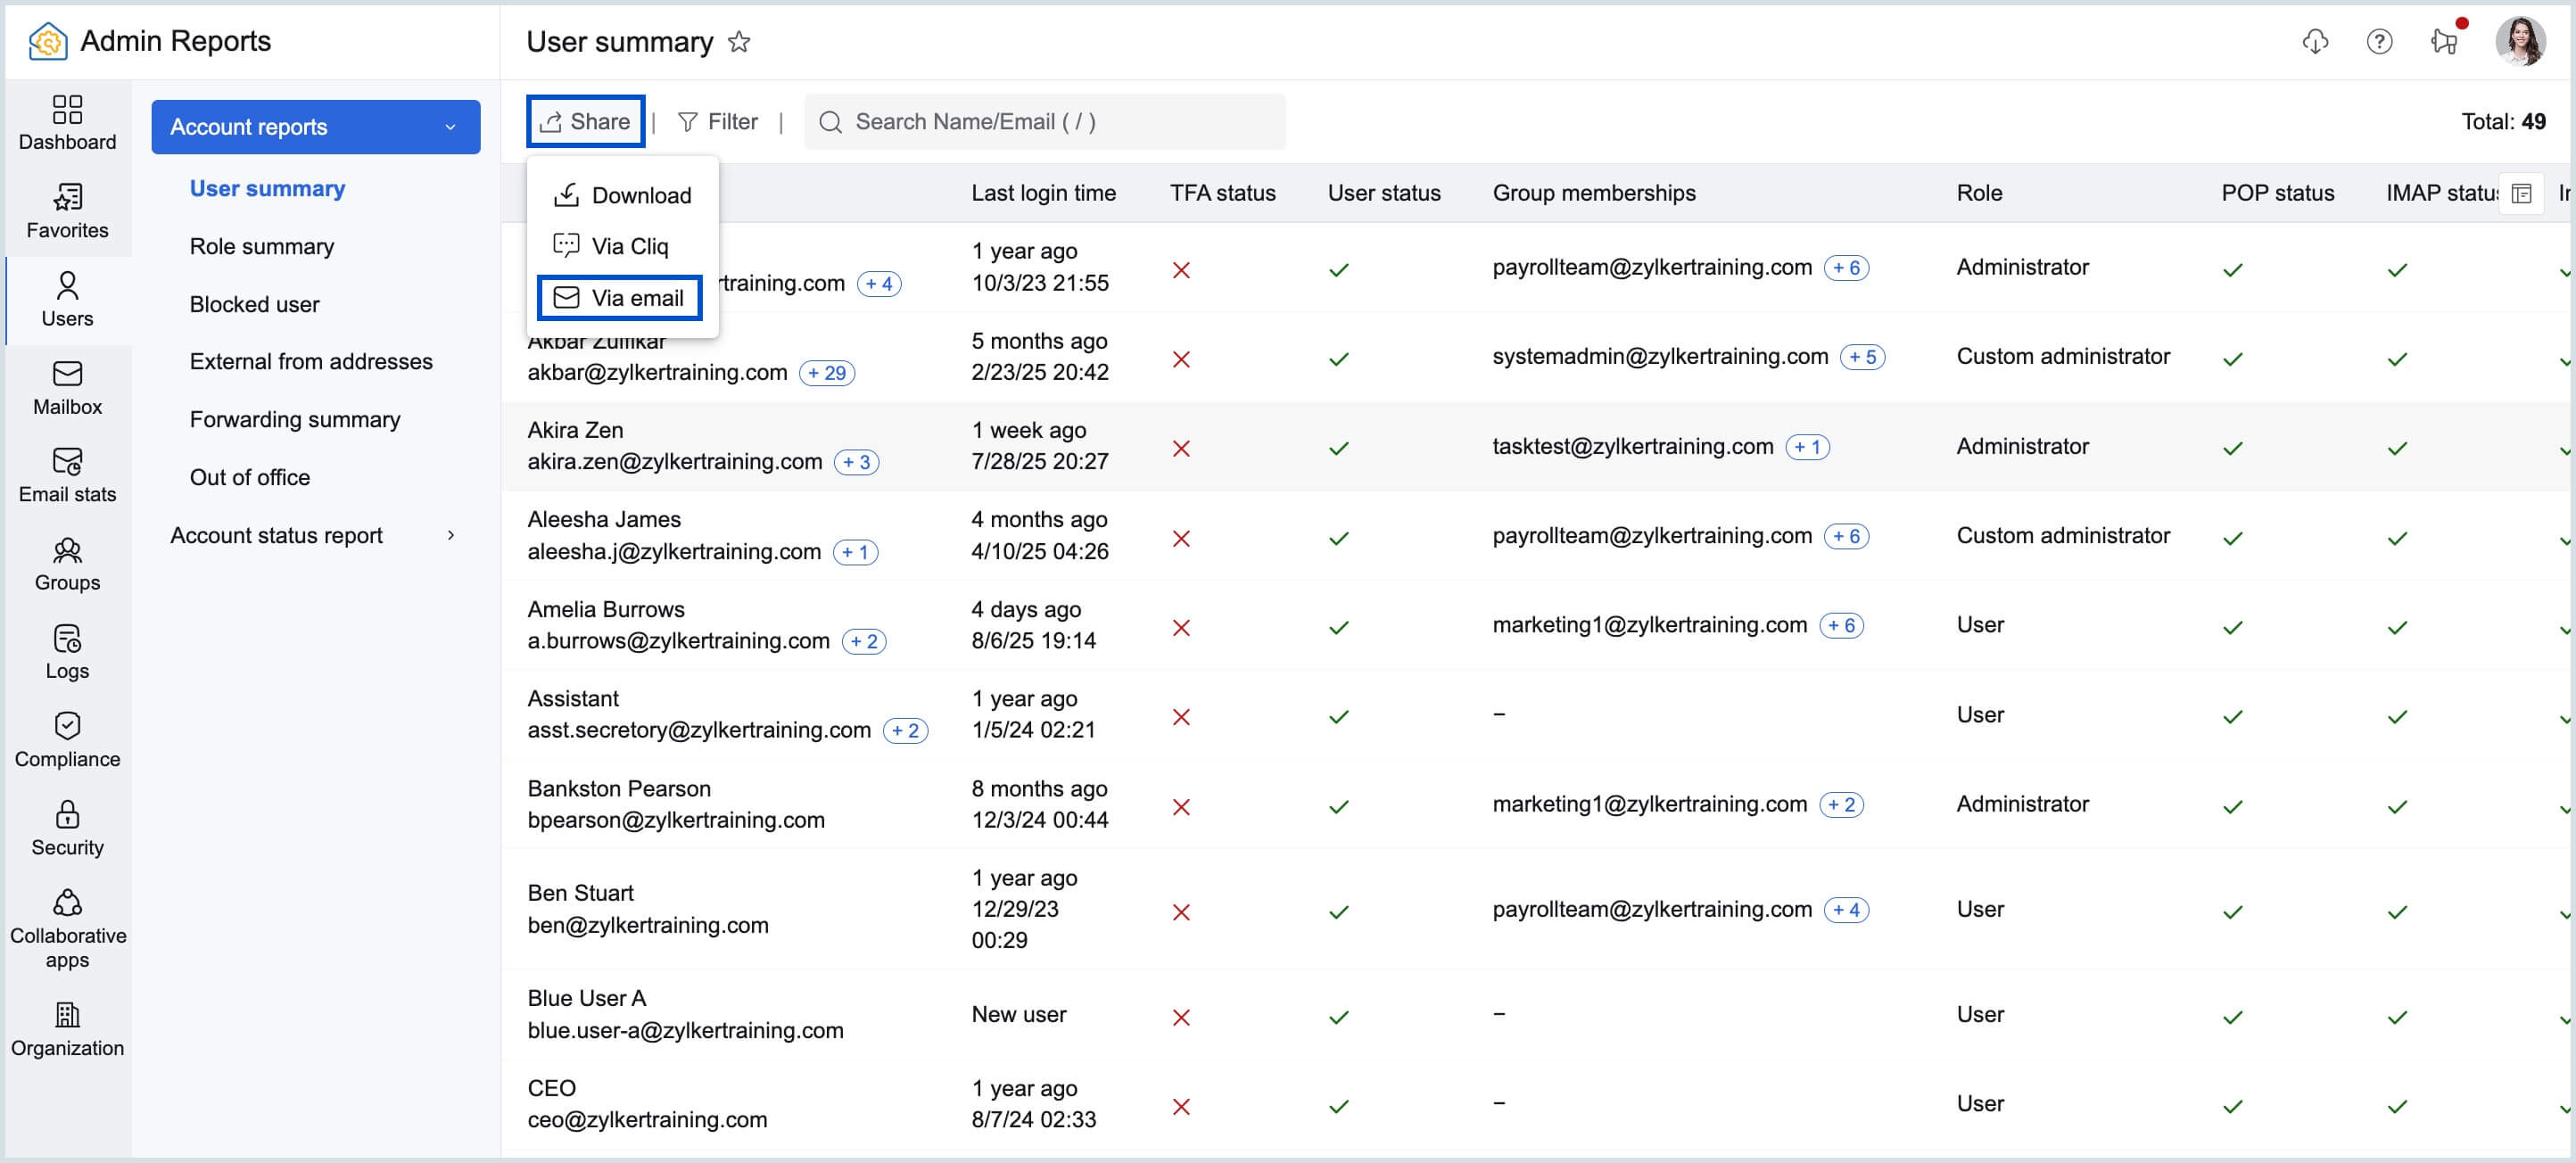
- Click the Share button and select Share via email.
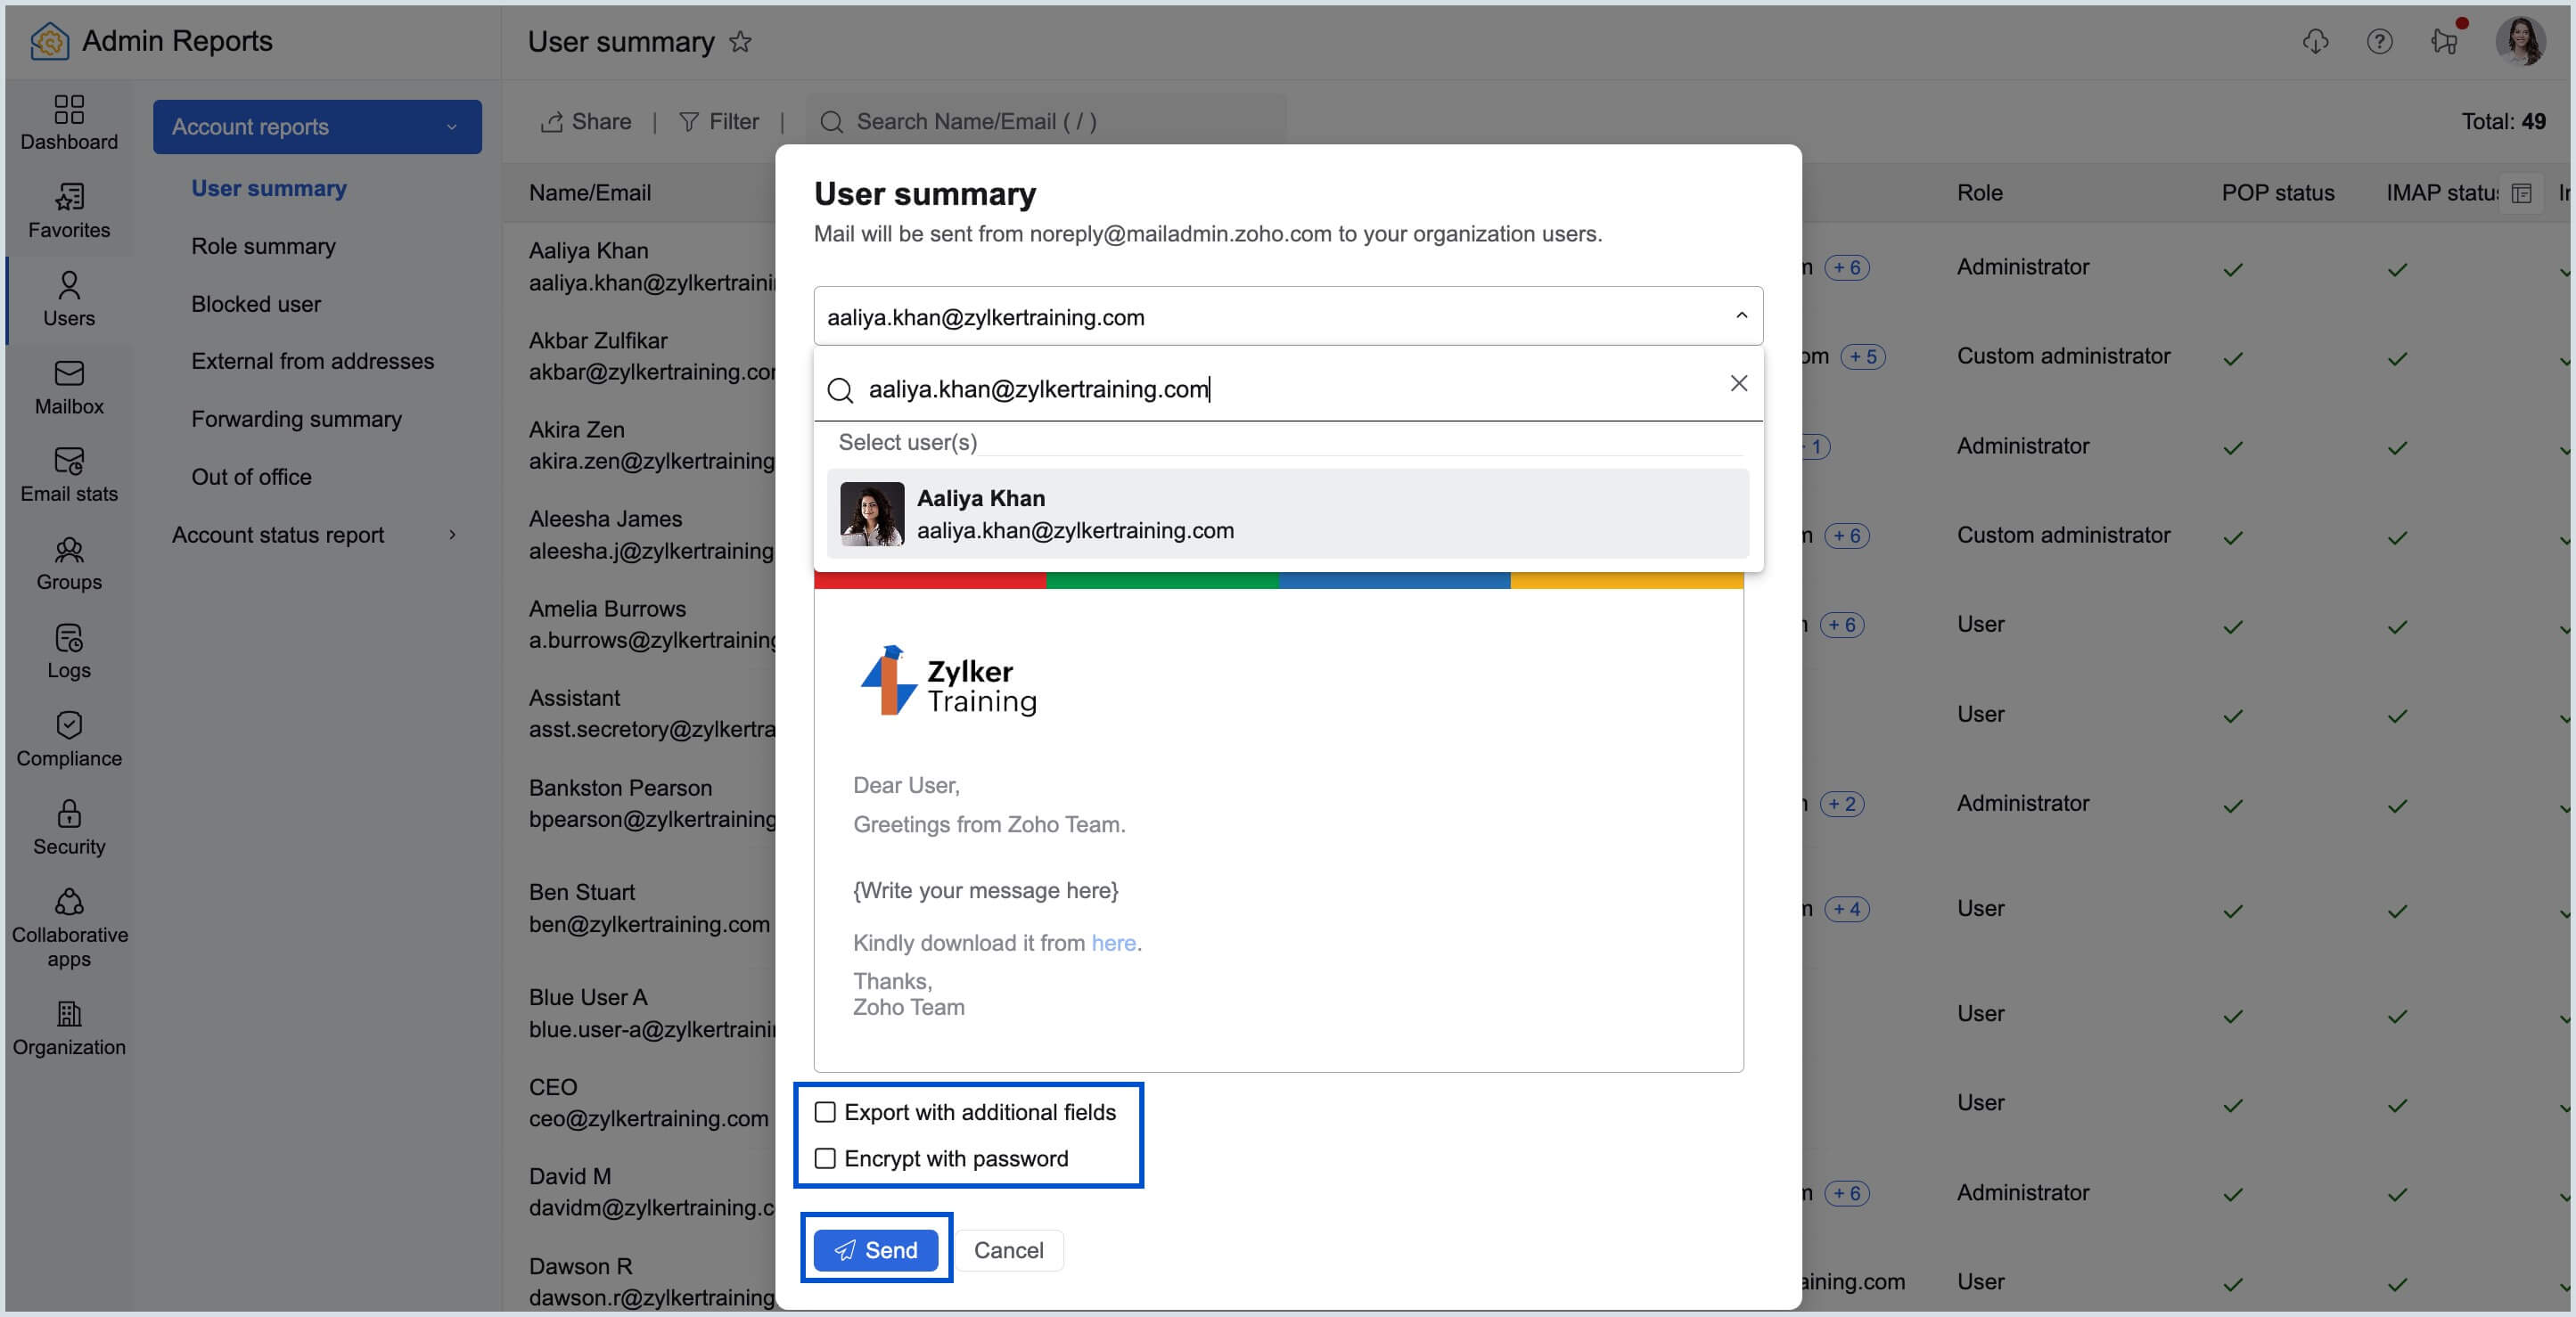
- Enter the email address of the intended recipient(s).
- The Subject field will automatically be populated with the report's name. You can modify it if necessary.
- Add a message to provide additional context or instructions in the email body.
- If applicable, you can encrypt the file or apply other export conditions as required.
- Click Send to share the report via email.
The report will be sent to the recipient's inbox, allowing them to access and download the report directly.
Note:
If you choose to share a report that takes time to generate the data file, the sharing process will be scheduled. You can track these reports in the Scheduled exports section to check whether they have been shared successfully.
Share via Cliq
For real-time collaboration or when you need immediate feedback on the shared report, you can share reports via Zoho Cliq directly from the Zoho Mail Admin Reports section. Here's how to do it:
- Log in to Zoho Mail Admin Console.
- On the left pane, click on the Reports section.
- Navigate to the report or hover over the chart that you want to share.
- Click the Share button and select Share via Cliq.
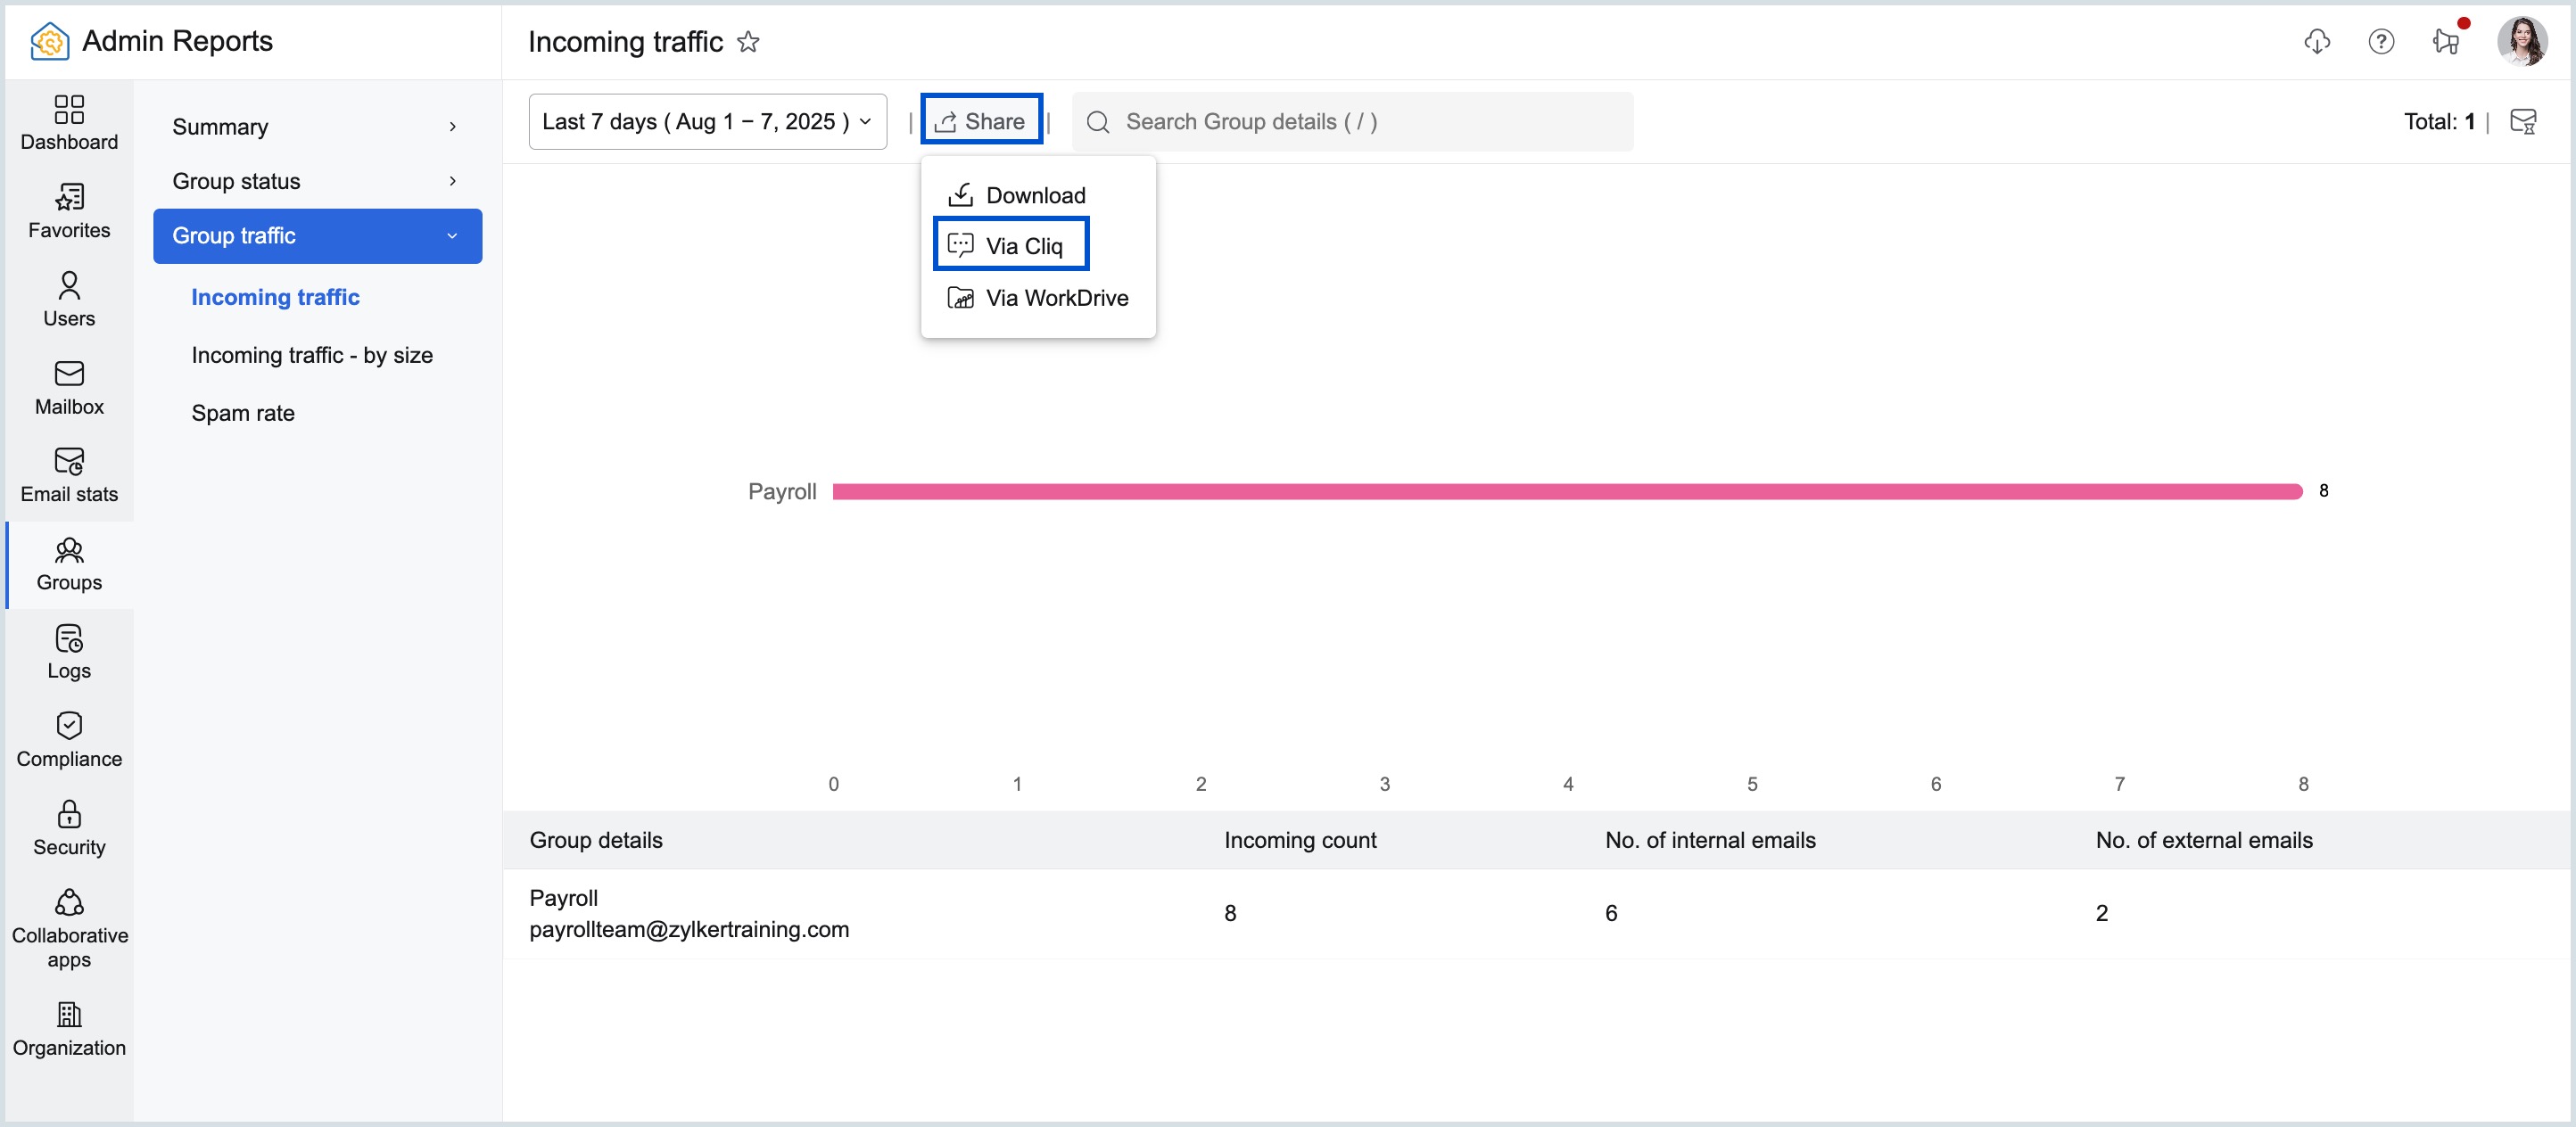
- If applicable, you can encrypt the file or apply other export conditions as required.
- Select the user, group or channel within Zoho Cliq that you want to send the report to.
- Click Send via Cliq to share the report through Zoho Cliq.
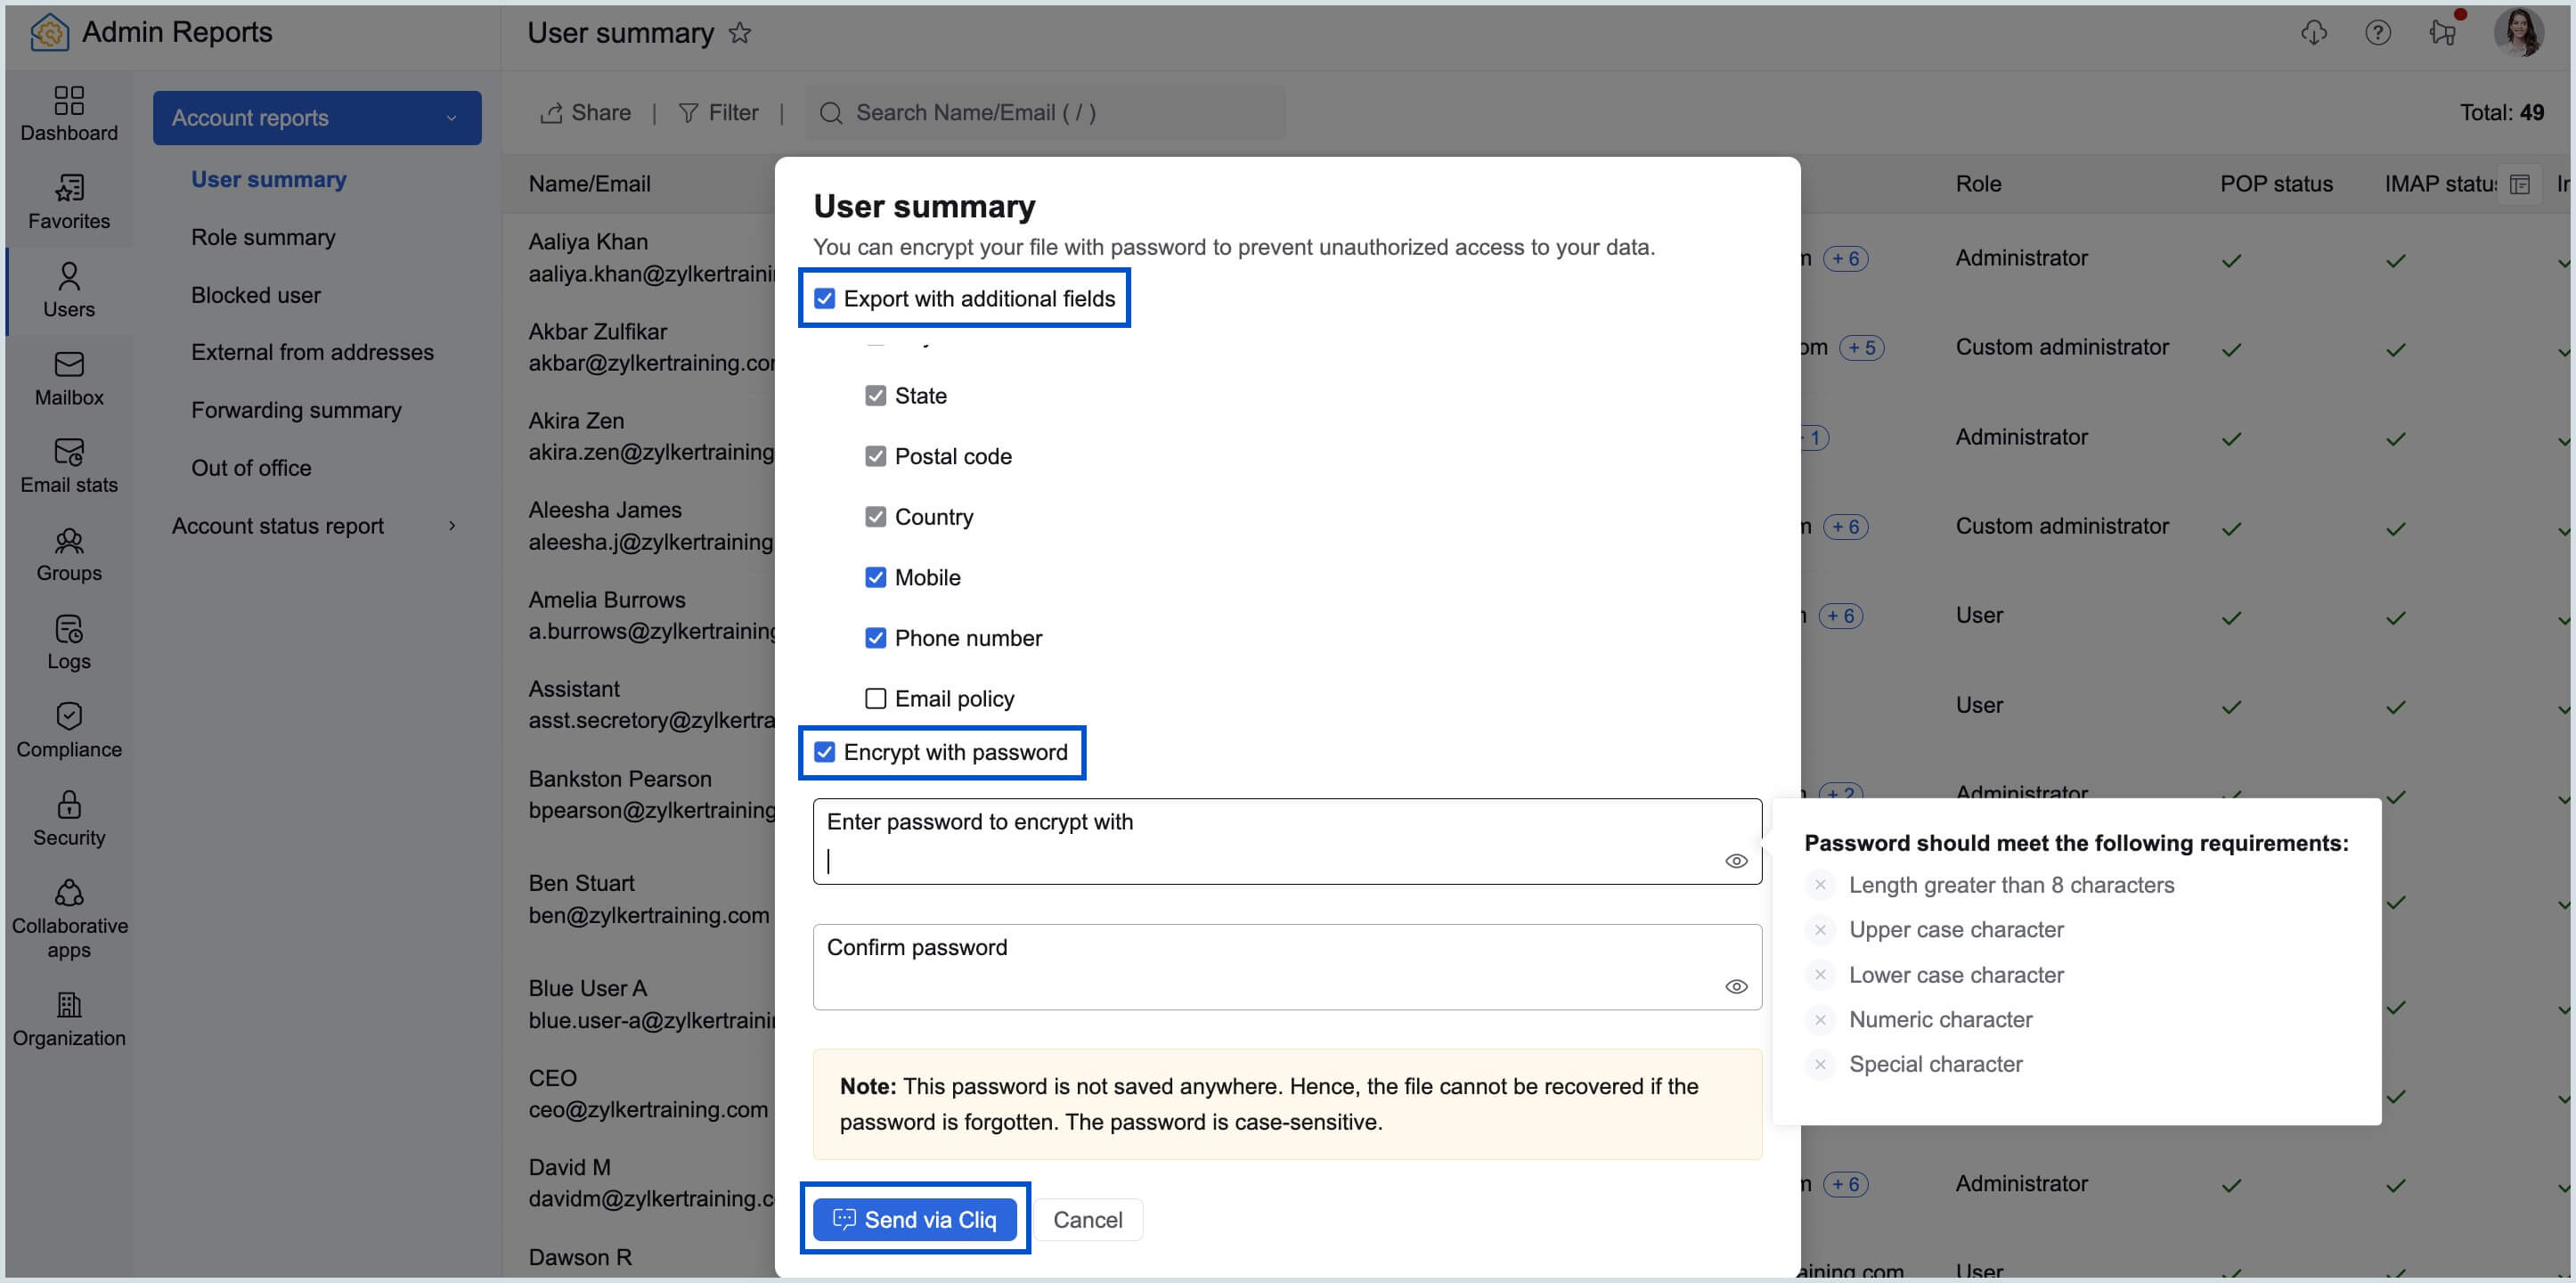
The report will be sent directly to the recipient's Zoho Cliq chat, where they can access the file and engage in further discussion if needed.
Note:
If you choose to share a report via Cliq and it requires time to generate the data file, the sharing process will be scheduled. You can track these reports in the Scheduled exports section to check whether they have been shared successfully.
Share via WorkDrive
For efficient file storage and team collaboration, you can upload and share reports through Zoho WorkDrive, allowing for seamless file sharing across teams.
To share a report via WorkDrive, follow these steps:
- Log in to Zoho Mail Admin Console.
- On the left pane, click on the Reports section.
- Navigate to the report or hover over the chart that you want to share.
- Click the Share button and select Share via WorkDrive.
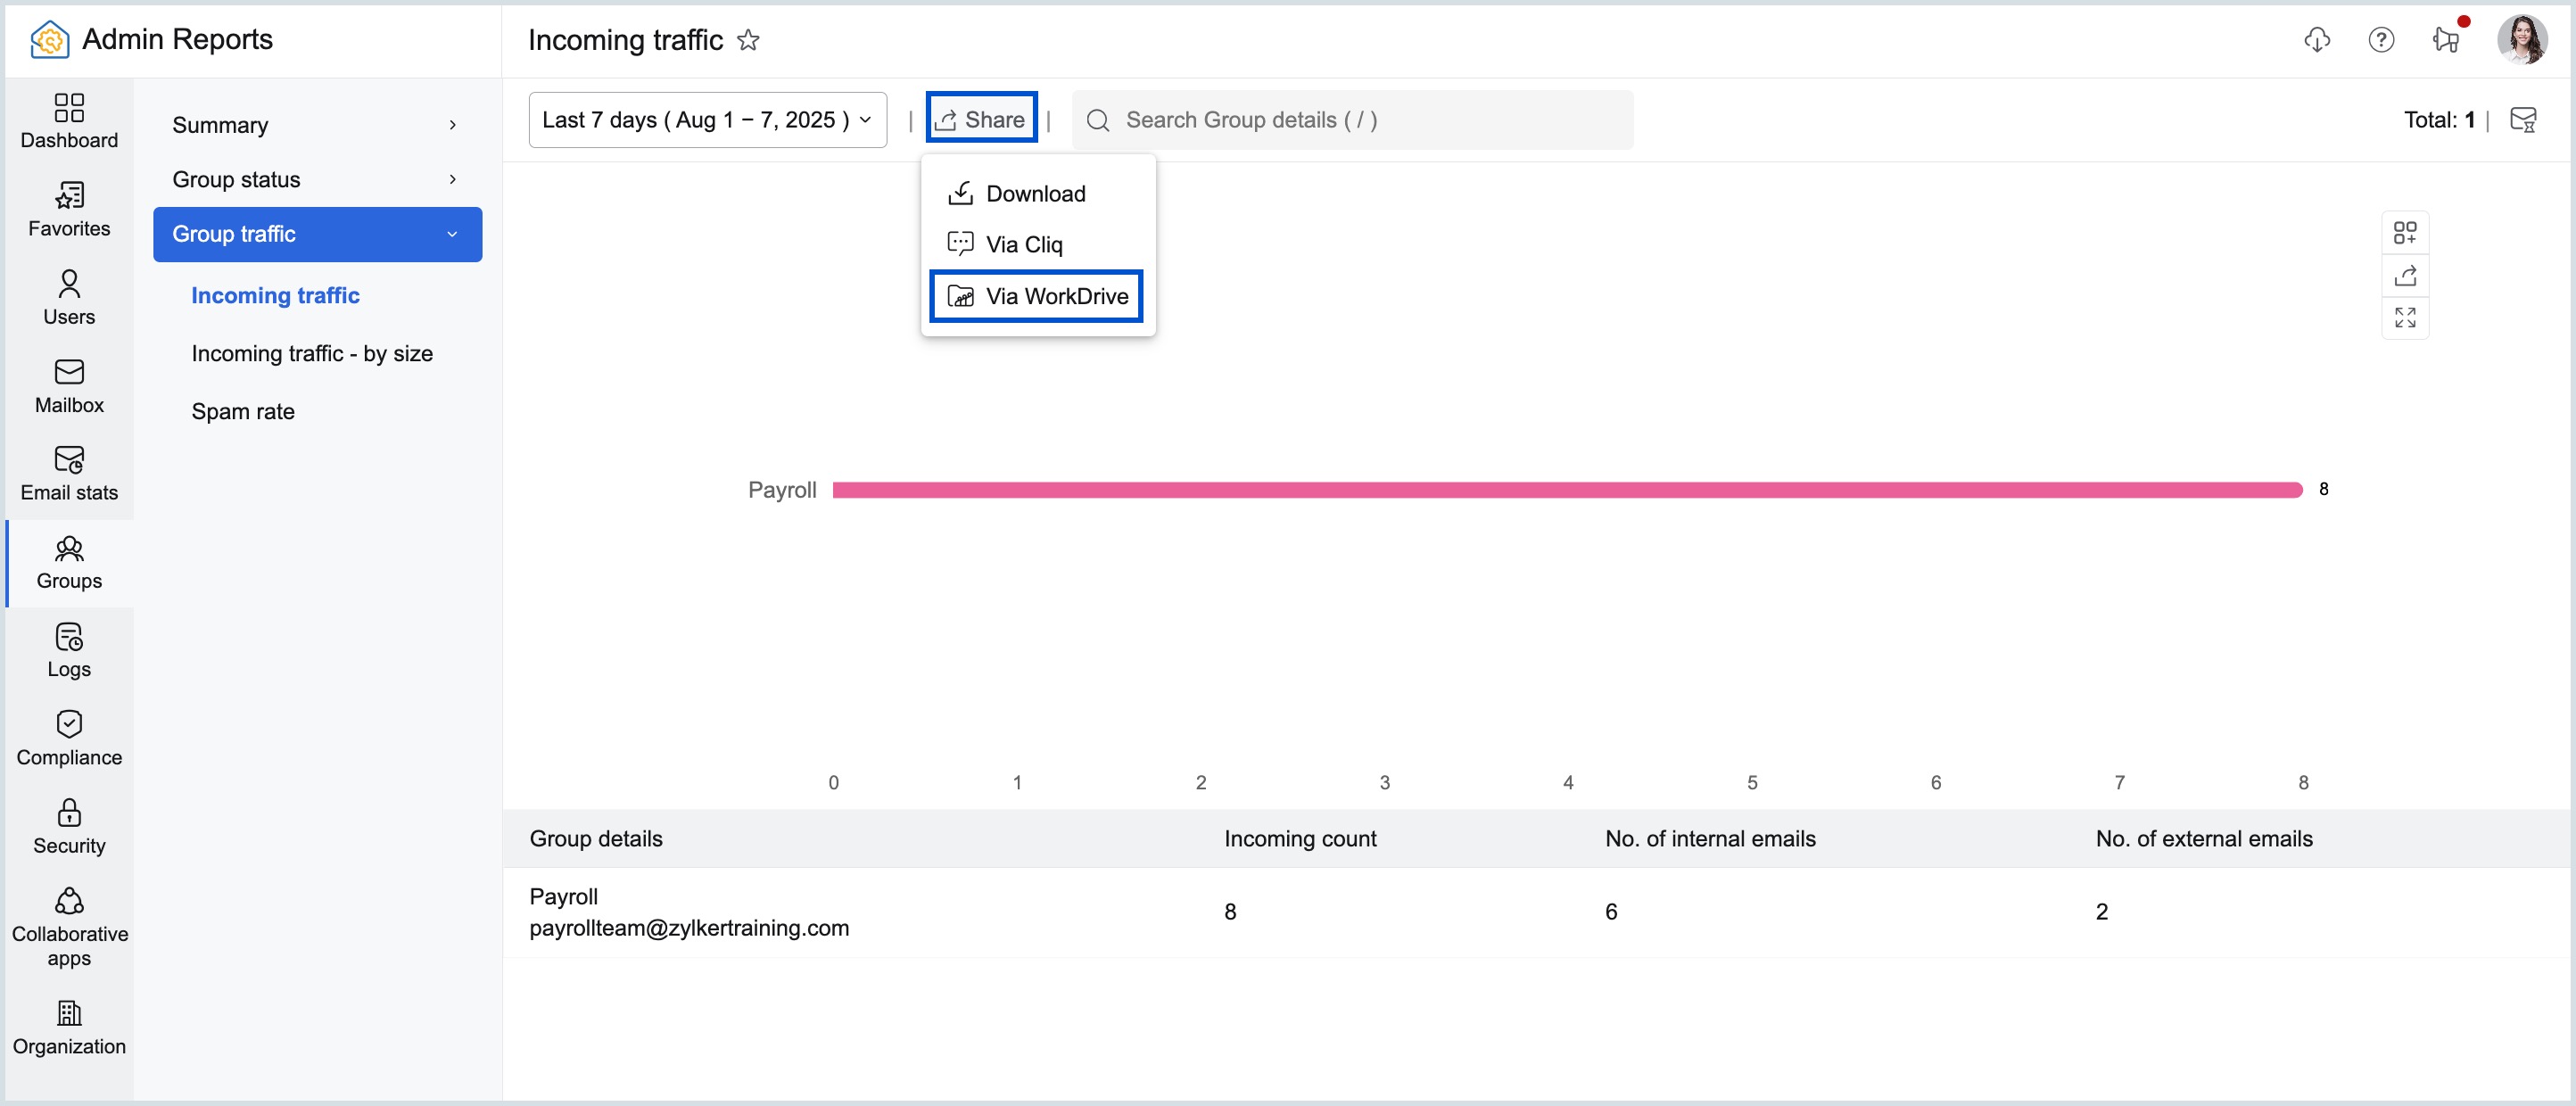
- You can encrypt your file by checking the Encrypt with password option and entering the password you want to use for encryption.
- Once done, click Add to workDrive.
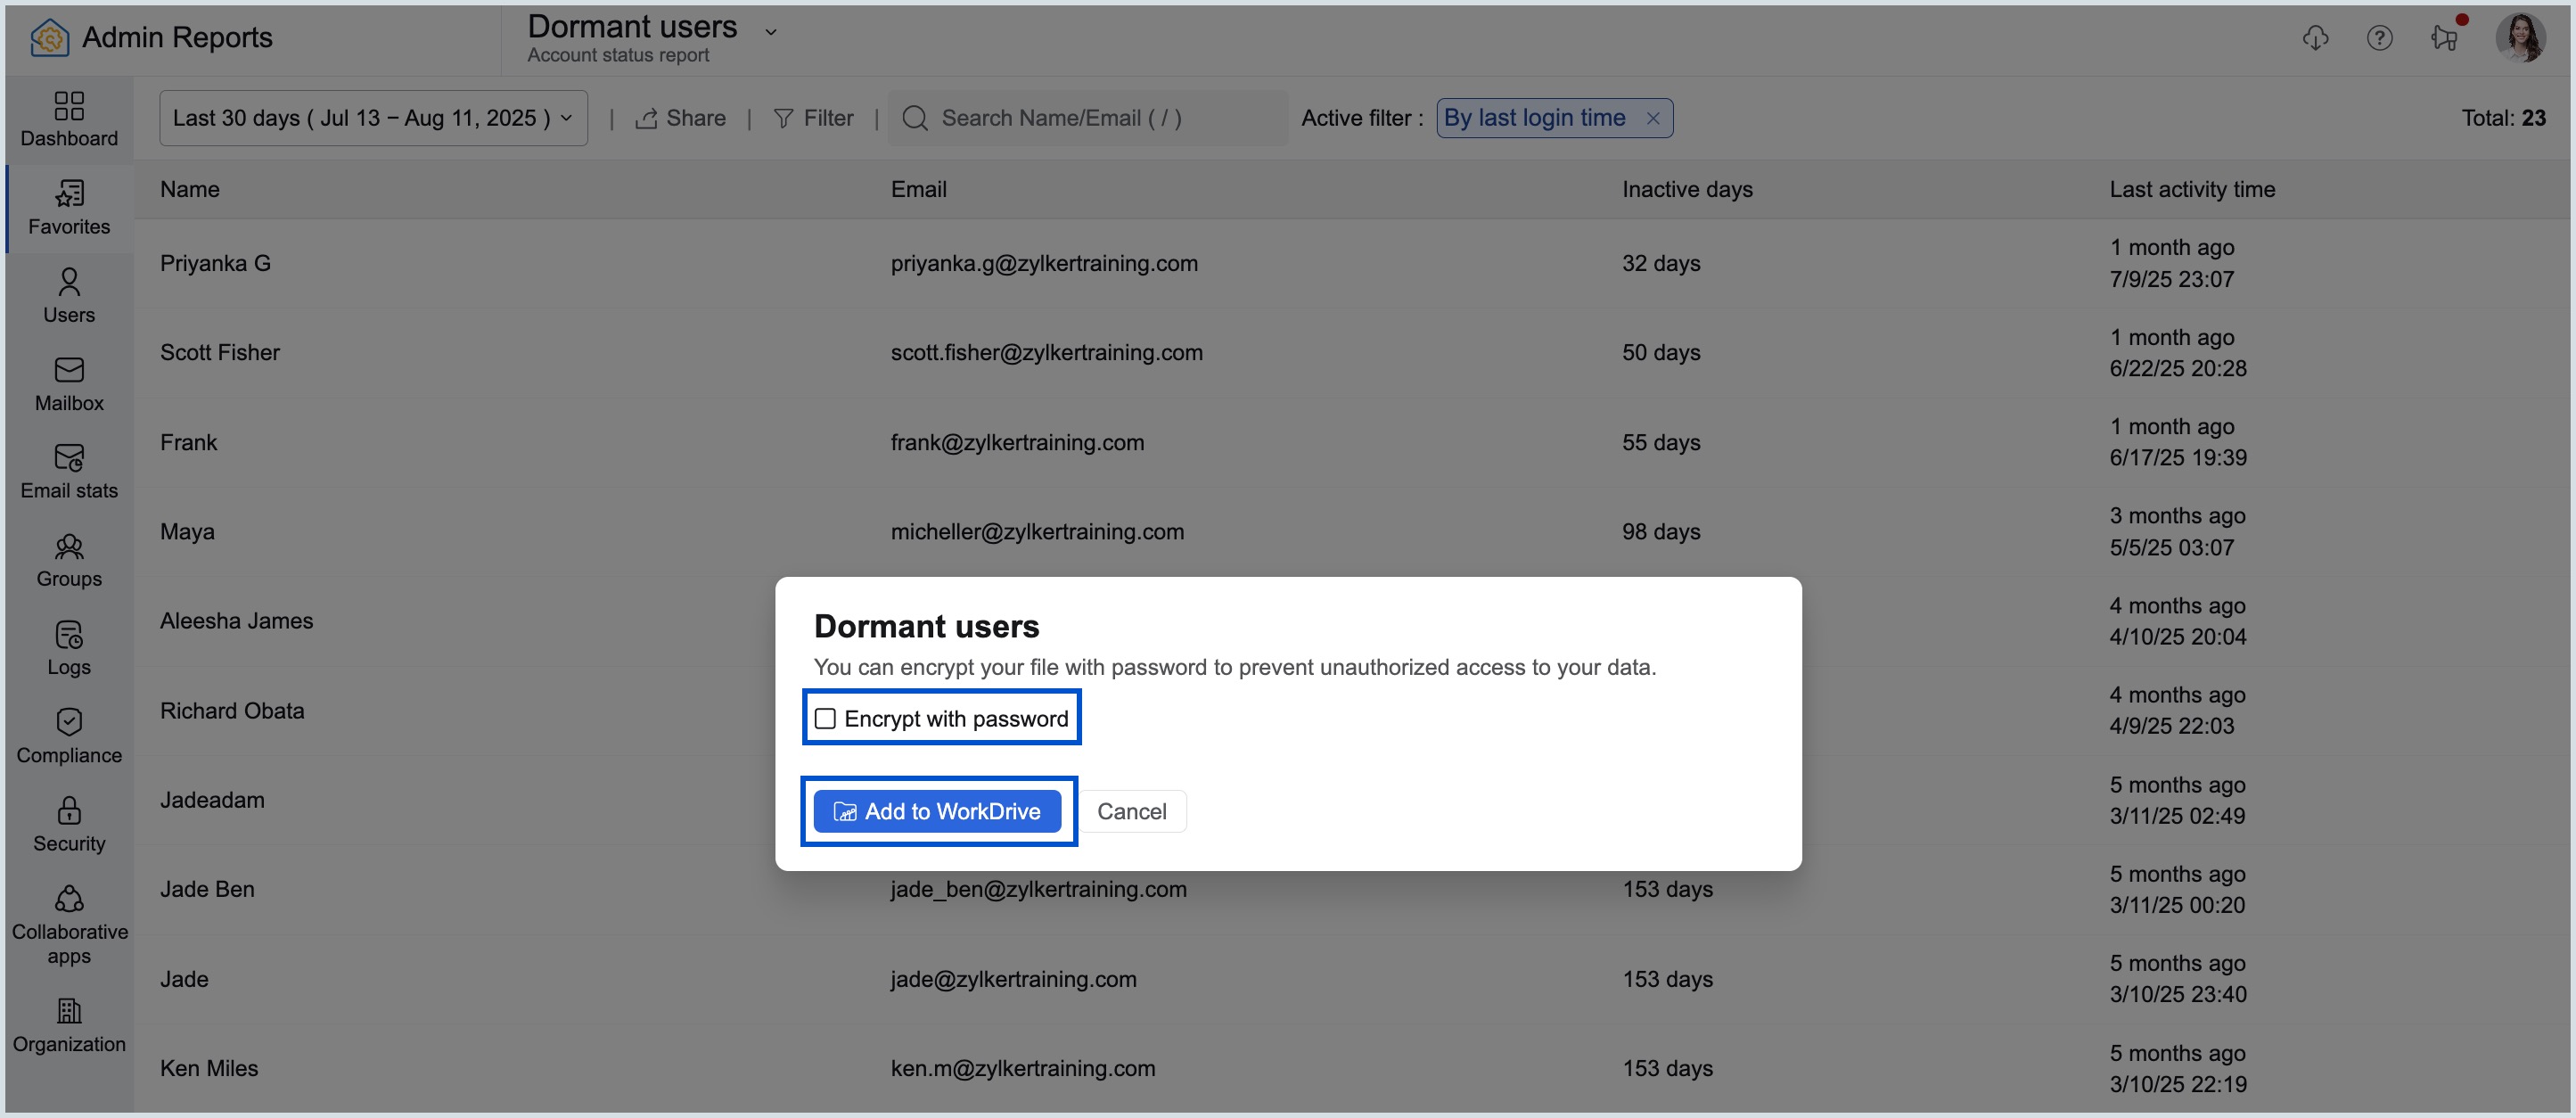
- Choose the folder in WorkDrive where the report should be stored and click Add.
The selected report will be uploaded to WorkDrive and accessible to those with the appropriate permissions.
Note:
The Share via WorkDrive option will only be available for specific reports.
Share Dashboard
To Share a dashboard in Admin Reports, proceed with the following steps:
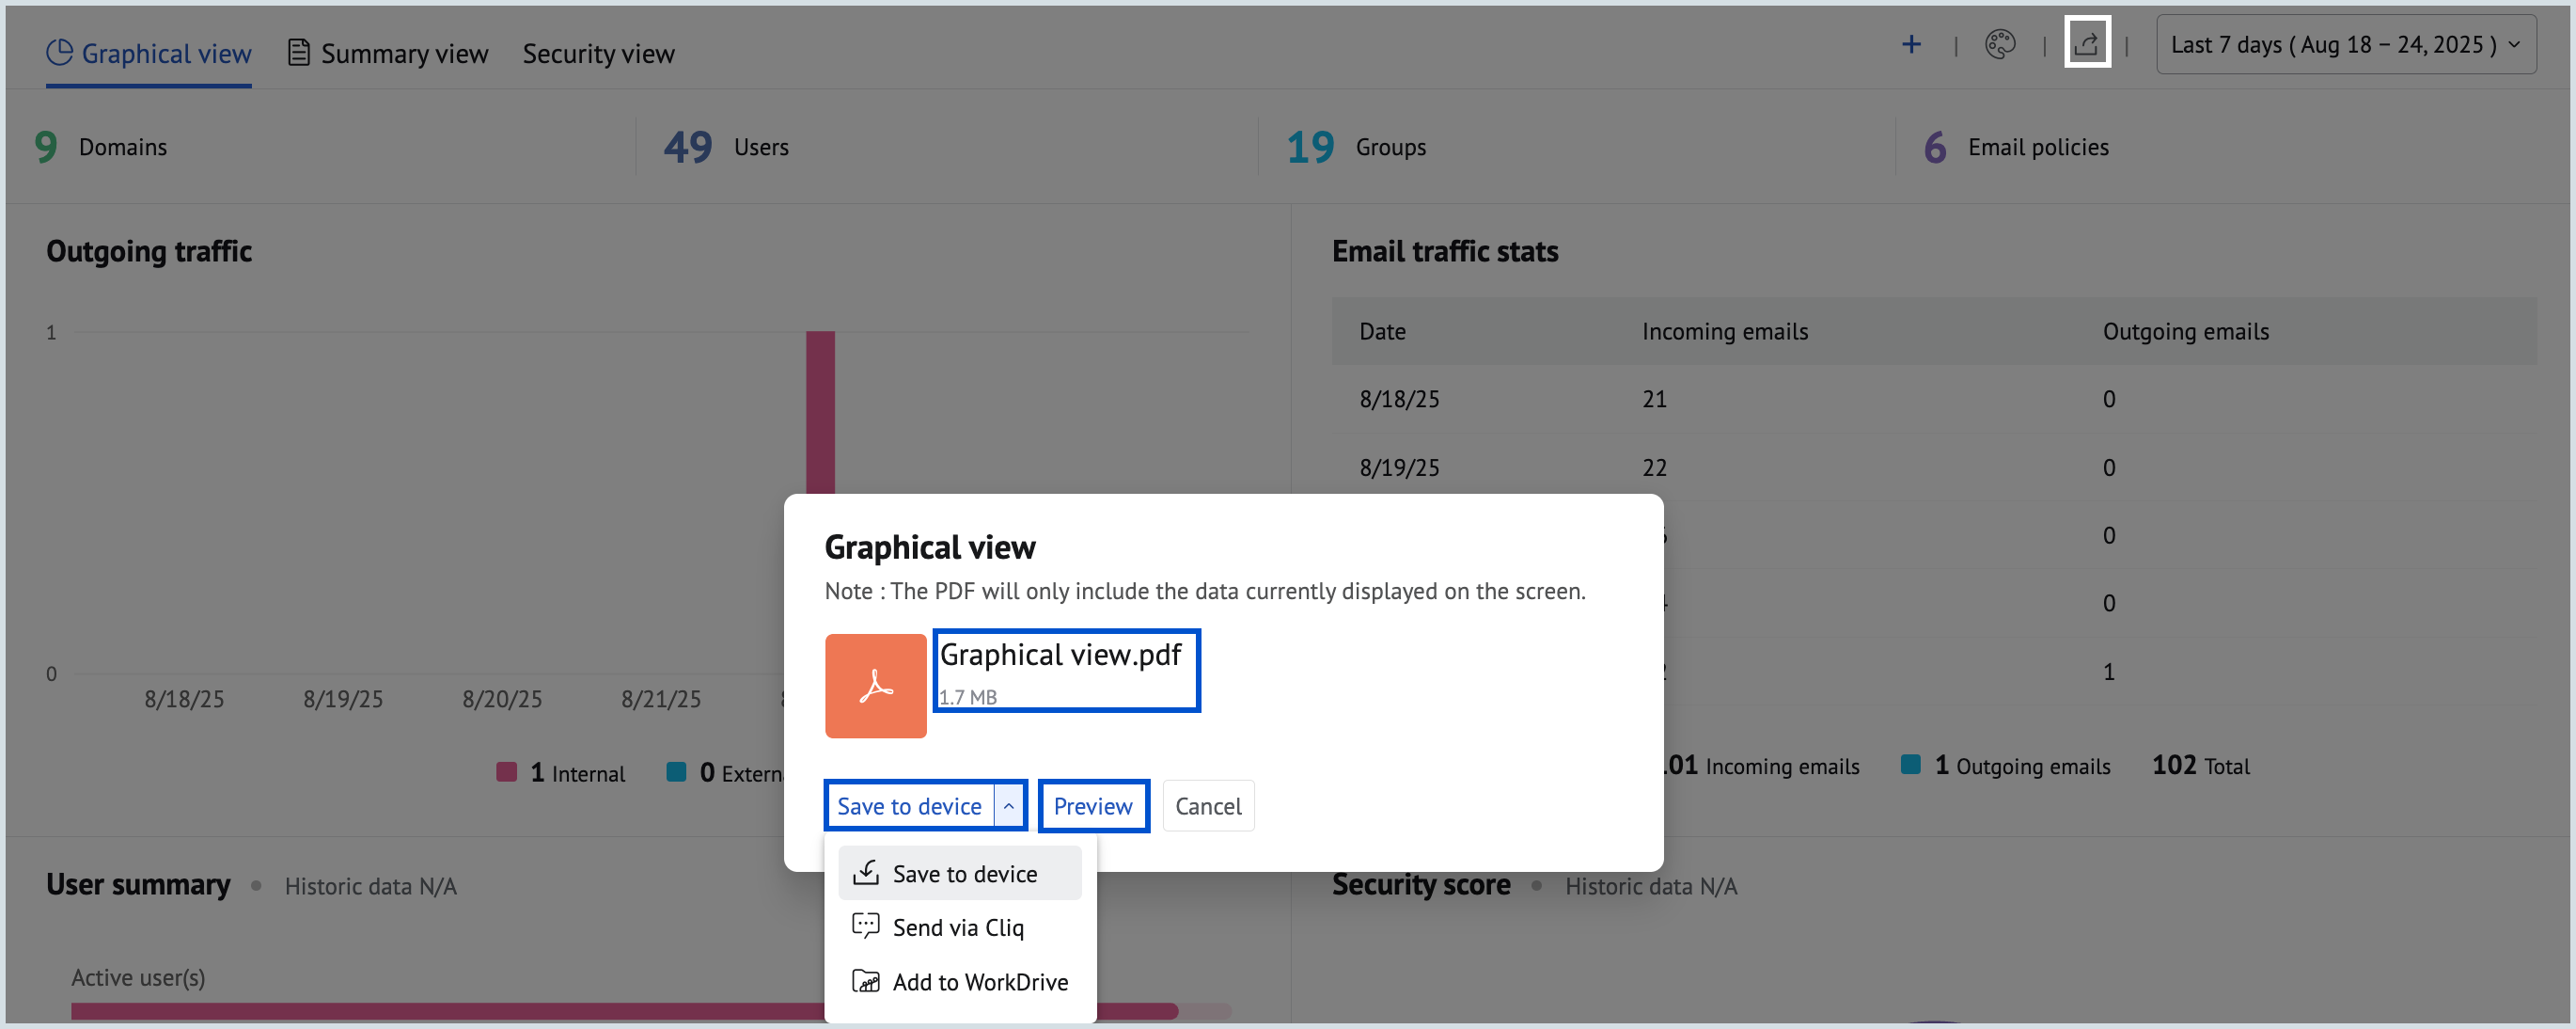
To share the dashboard data, go to the desired dashboard, click the Share icon in the top pane, and choose either CSV or PDF as the file format.

- Choose the appropriate option from the dropdown menu in the pop-up window and actions from the pop-up window will appear, allowing you to:
- View the file name and file size of the export.
- Select your preferred action from the drop-down menu:
- Save to device - Save the file directly to your device.
- Send via Cliq - Share the file with up to five email addresses by selecting the recipients and clicking Send.
- Add to WorkDrive - Select the desired folder in your WorkDrive and click Add.
- Click Preview to review the file before sharing or saving it.
Note:
The Preview option is available only when the file is shared in PDF format.
Scheduled Exports
Exporting or sharing reports such as User Summary, Group Summary, Protocol Status Details, Protocol Access Details, and Storage Details may require time to generate the data file. You can track these reports and download them from the Scheduled exports section.
To see the status of all the exports you've scheduled, follow these instructions:
- Log in to Zoho Mail Admin Console.
- On the left pane, click on the Reports section.
- On the Admin Reports page, click the Scheduled exports icon in the top-right corner.
- Reports that have successfully completed the downloading or sharing process will display a Completed status.
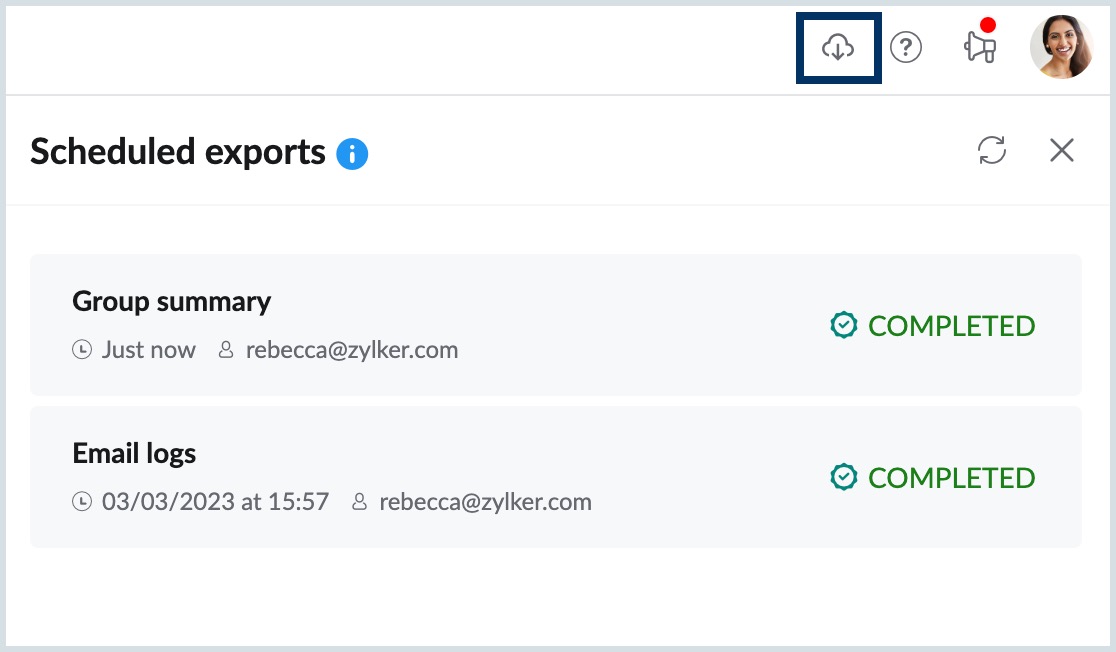
You can now view all the exports with the date and time information you scheduled. If required, you can also choose to download or share the report via Zoho Cliq from here. This section will only show scheduled exports from the past 30 days.
Configuration
The Admin Reports Configuration will help you customise your reports based on your preference. To access the configuration settings in Admin Reports, follow these instructions:
- Log in to Zoho Mail Admin Console and select Reports on the left pane. The Admin Reports page opens in a new tab.
- Select Configuration on the left menu.

- In the Configure section, select General from the left menu to set essential preferences, including your report’s visual layout and export format. These settings determine how your reports are displayed and shared.
- You can also select Recurring to create and schedule reports for sections such as Mailbox, Email Stats, and Groups Traffic.
General
Inorder to configure your preferred settings such as Save and display subject in email logs, Reset dashboard to default settings, Report export format and widget theme navigate to the General section from the left pane of the pop-up window.
- Save and display subject in email logs - Enable the toggle button to save the email subject in the email logs and reports.
- Reset dashboard to default settings - Click on the button to reset the dashboard to default settings. This will reset all the widgets and charts in the dashboard to the default setting.
- Report export format - Choose the preferred format to export the graphs. The available options are PNG, JPEG and SVG.
- Widget Theme - Select your preferred dashboard theme. The chosen theme color will be applied to all reports and the current dashboard you're viewing.

Note:
- The Save and display subject in email logs settings will be disabled by default.
- If enabled, the subject will be saved in the logs only from the time it is enabled. The subject will be available for this period even if you change the setting in future.
Configuring Recurring Reports
Configuring Recurring Reports provides insights into frequently accessed reports directly from your mailbox and enables you to take necessary actions from the Admin Console. These insights help you take proactive measures such as configuring security settings based on email traffic for users, groups, or domains, purchasing add-ons, or alerting users to manage their mailbox storage.
The Recurring Reports feature lets you automatically generate and send reports to selected email addresses on a daily, weekly, or monthly schedule, based on the created configuration. You can configure and generate Recurring Reports for the Mailbox, Email Stats, and Group Traffic sections. Follow the steps below to configure a new Recurring Report:
- Log in to Zoho Mail Admin Console.
- On the left pane, click on the Reports section.
- You will be redirected to the Admin Reports page.
- Click the Configuration icon in the bottom-left pane.
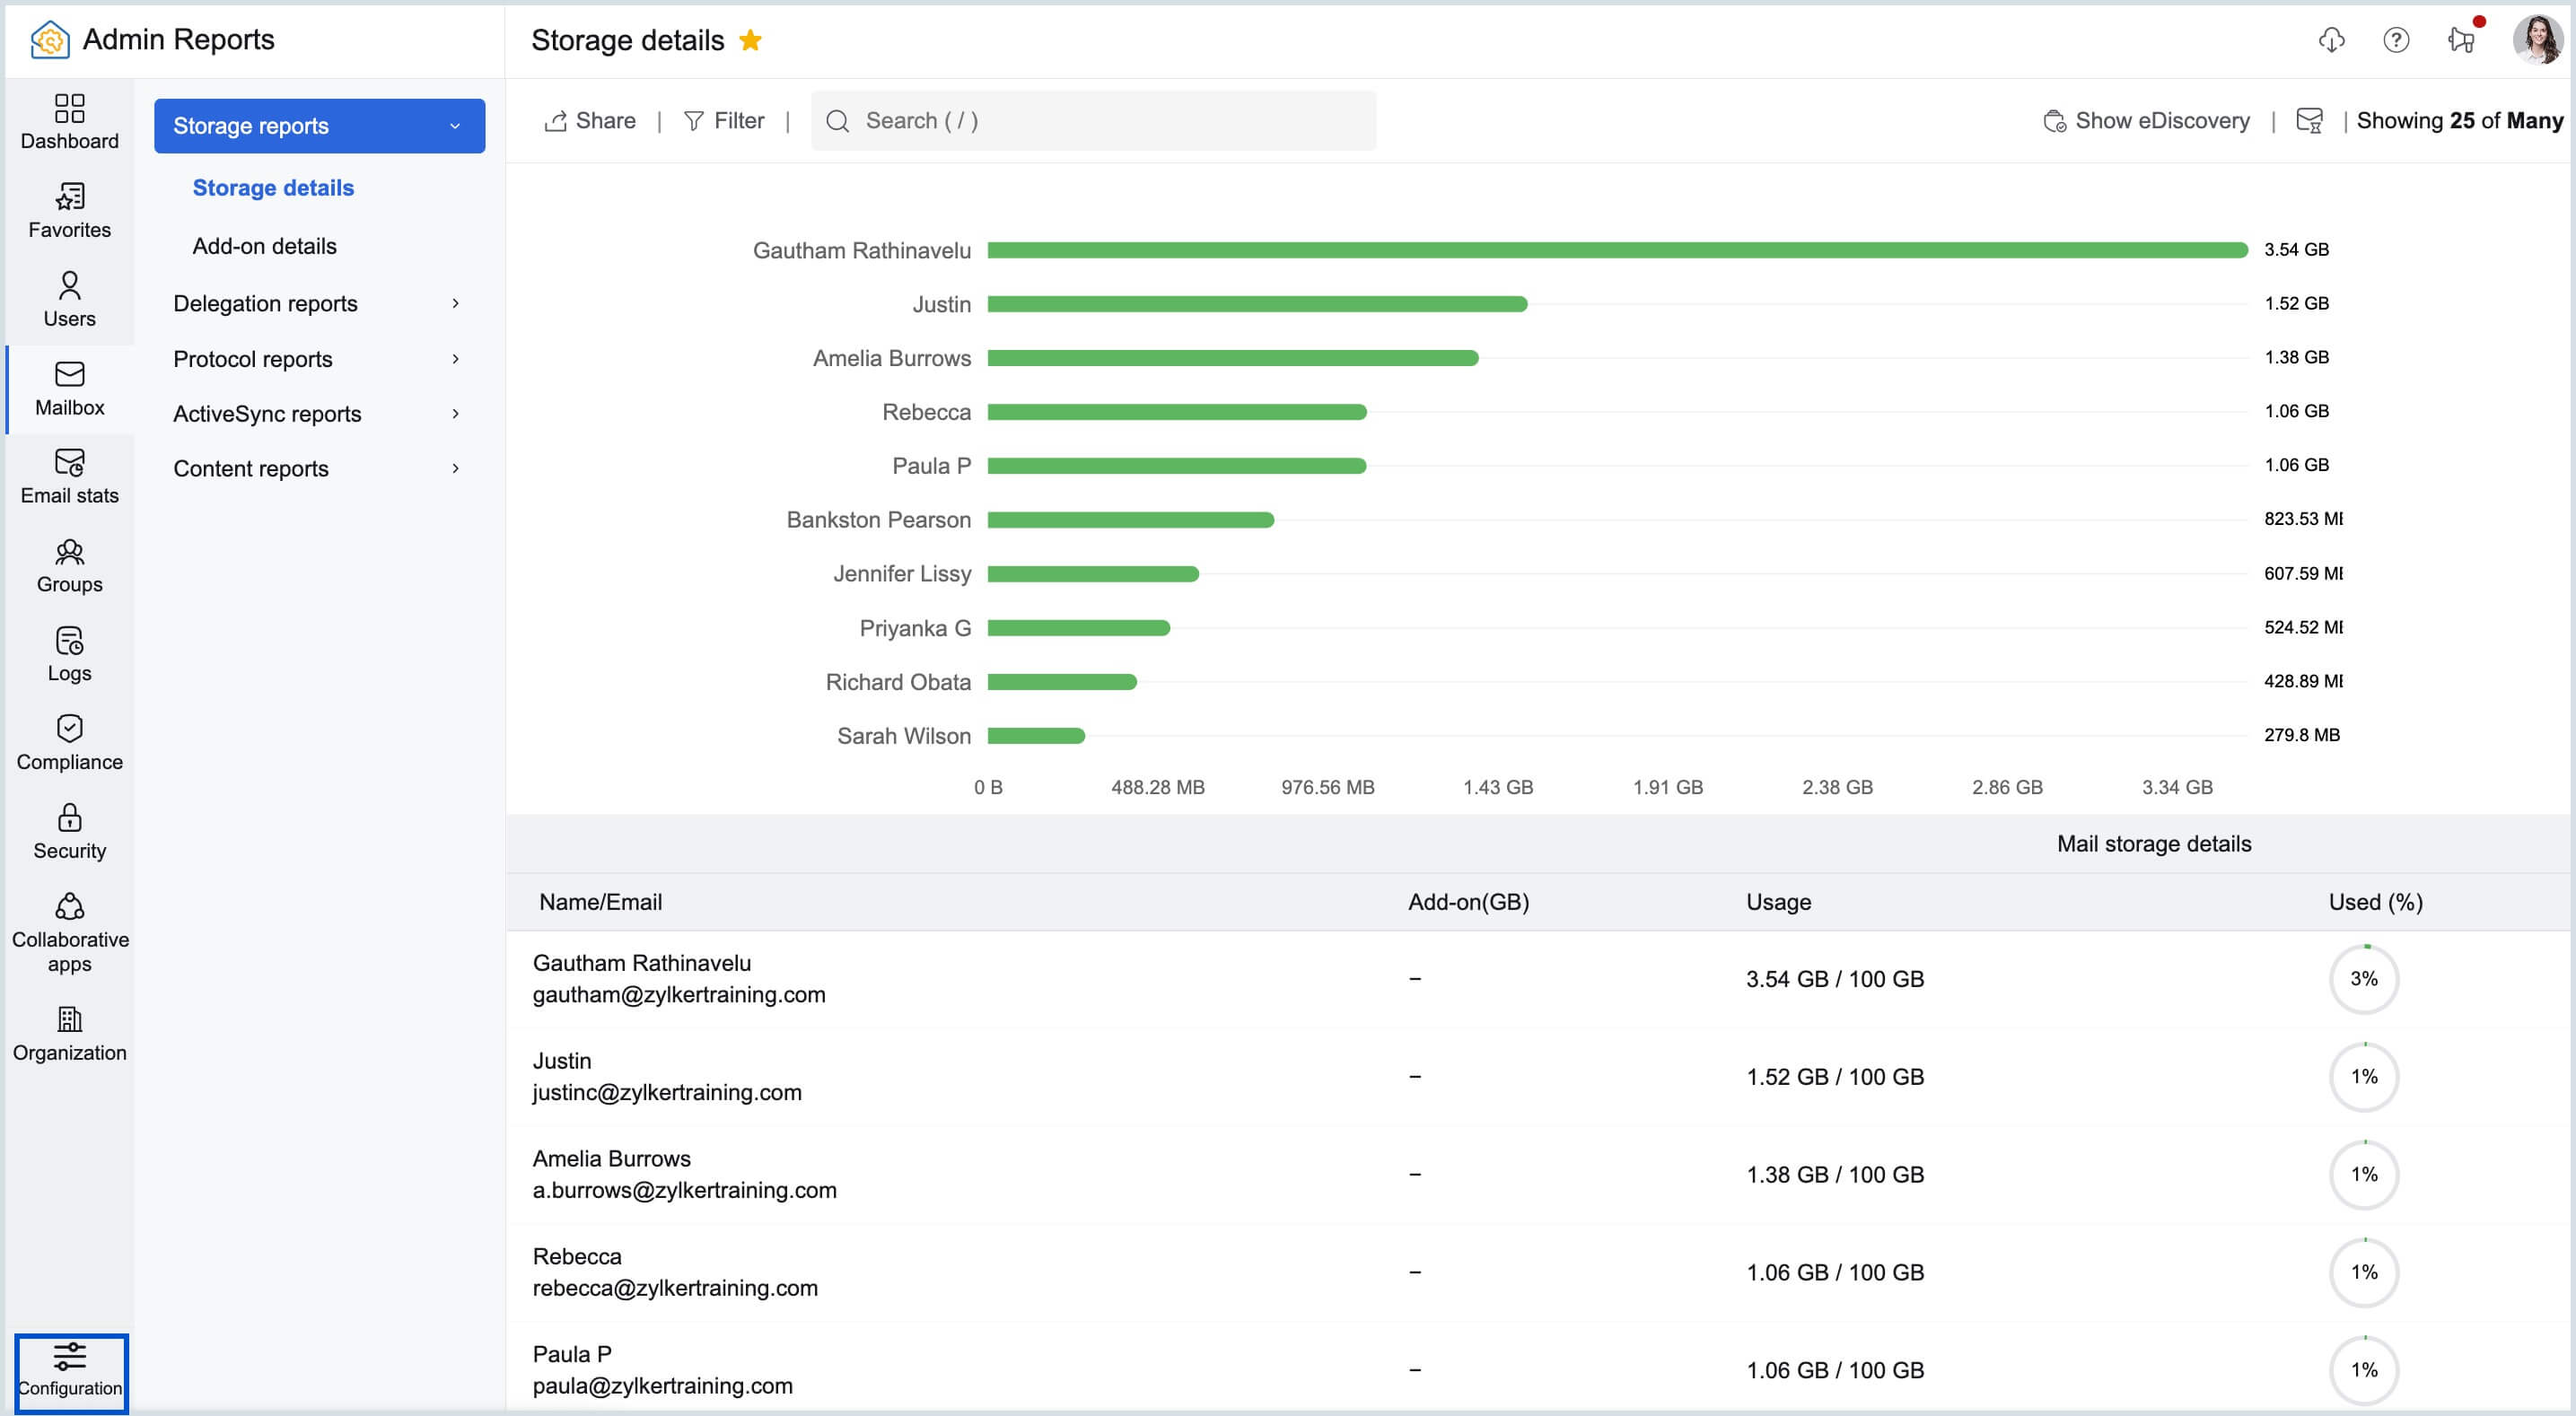
- Select Recurring from the options.
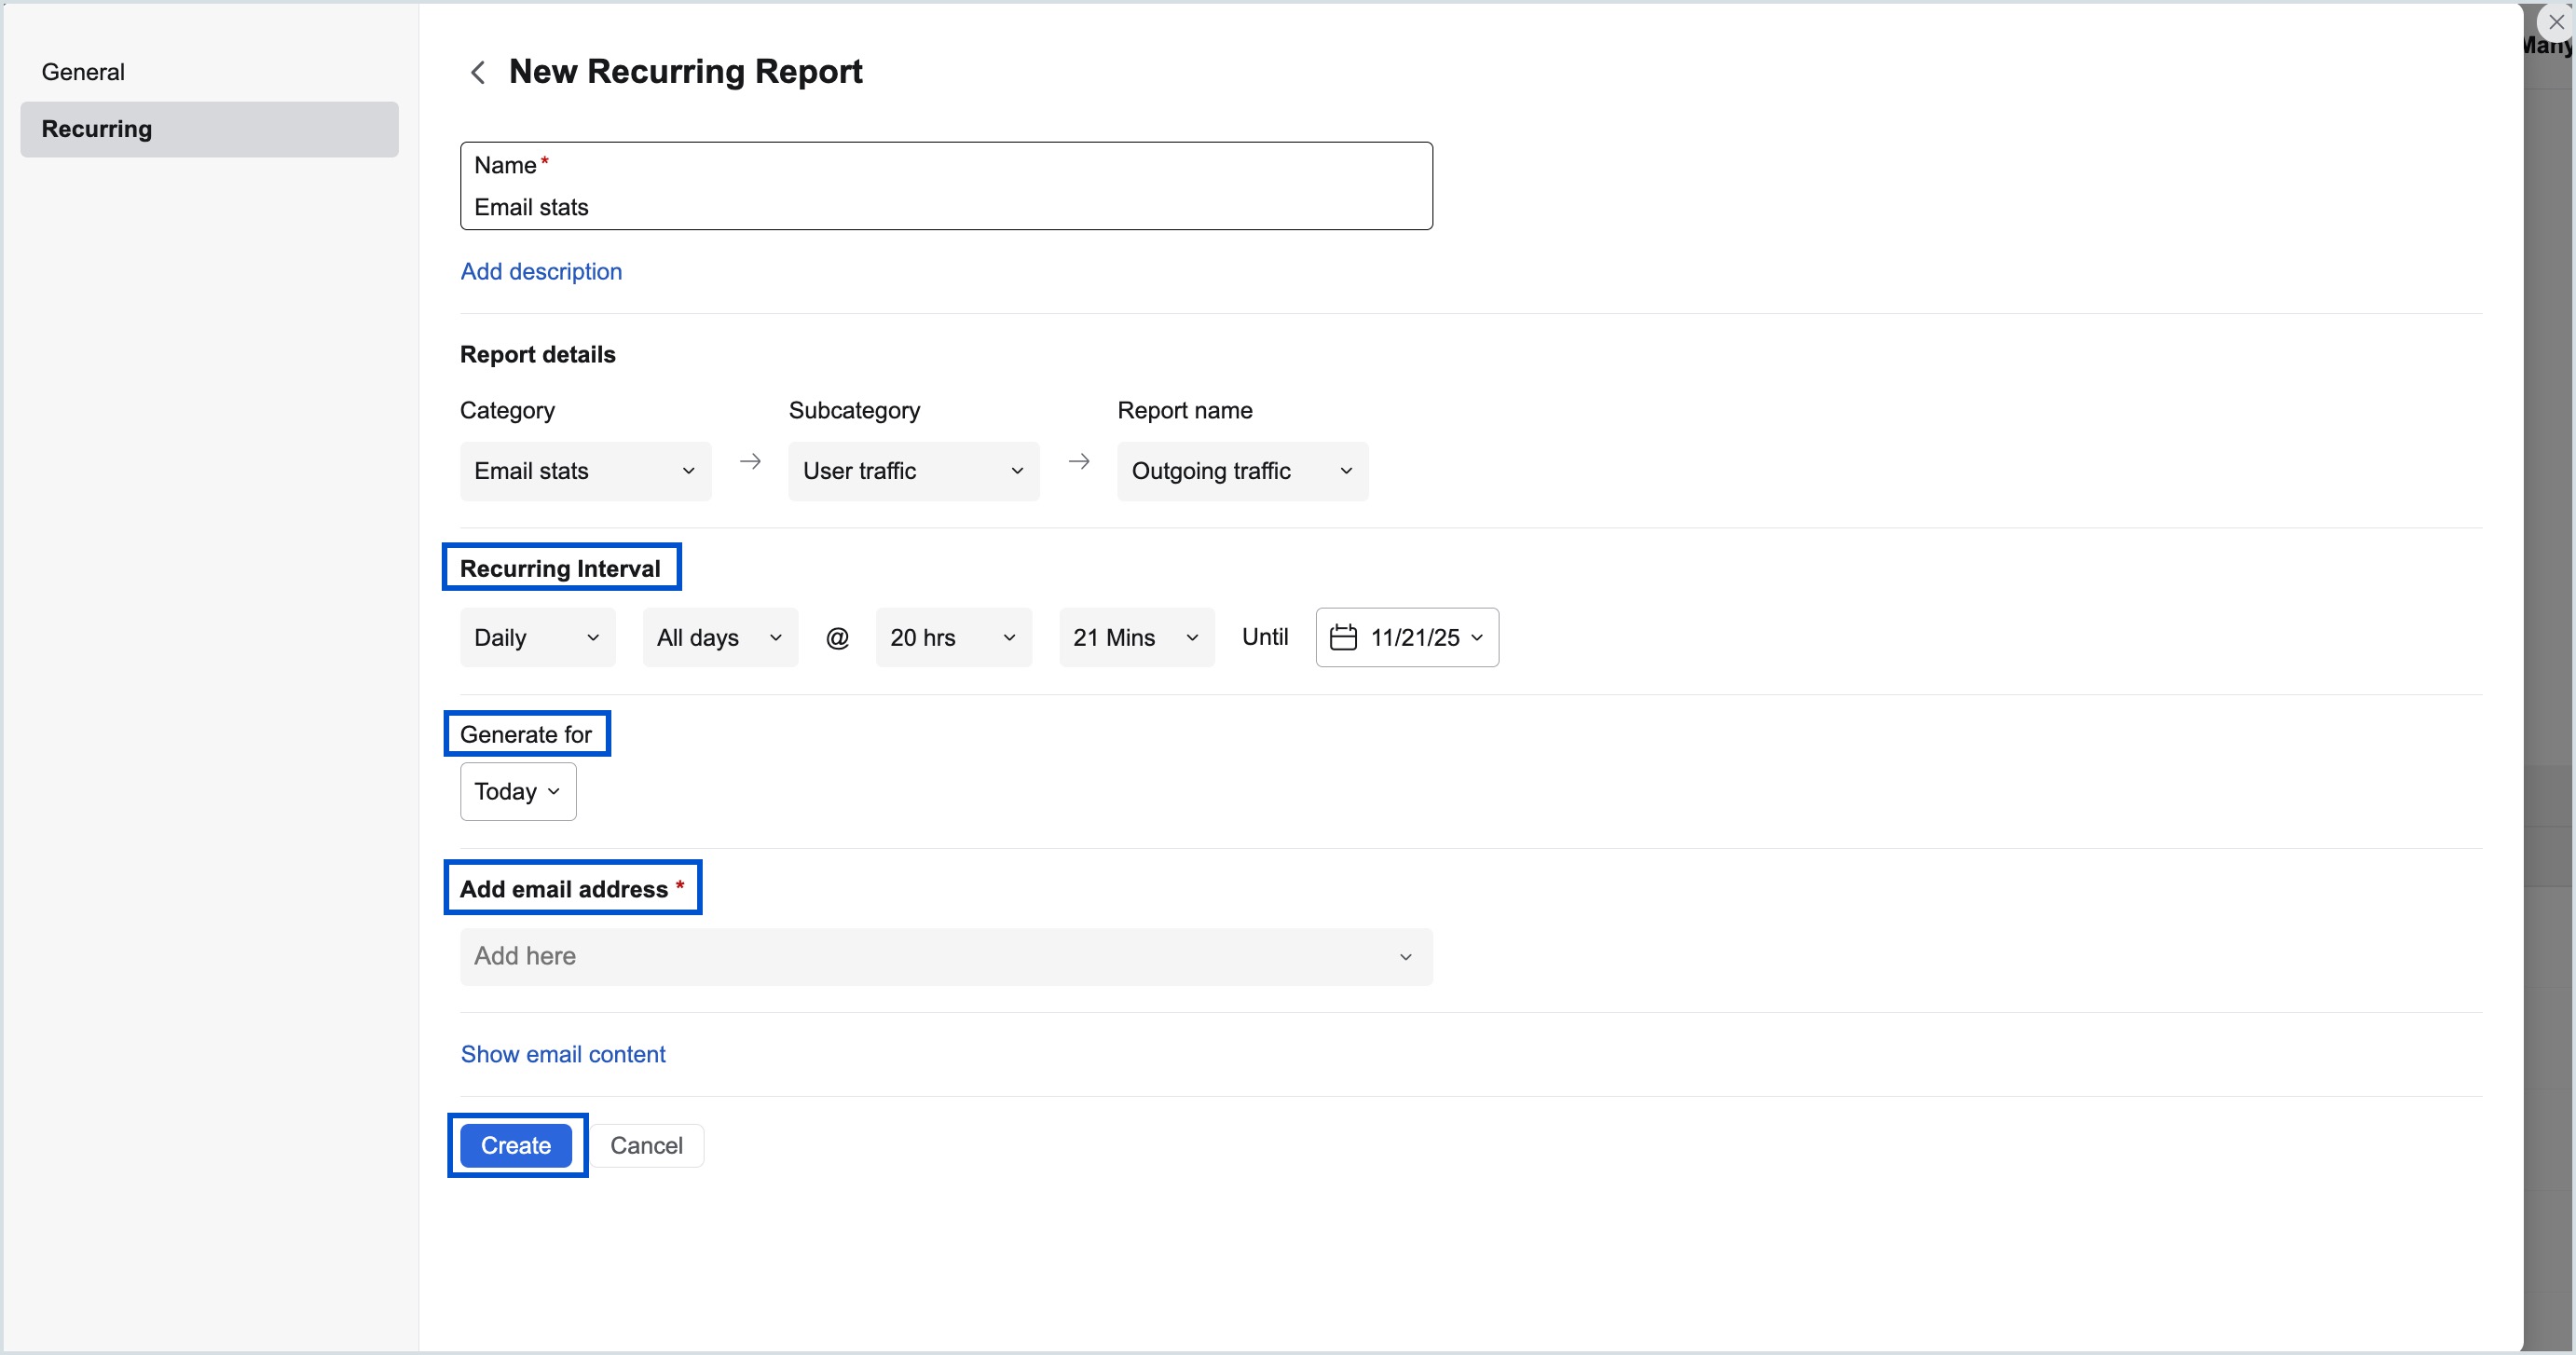
- On the Recurring Reports page, click New to create a new recurring configuration.

- Enter a Name for the Recurring Report.
- If required, click Add description and provide a brief description for future reference.
- In the Report Details section, select the required Category, then choose the relevant Subcategory and Report Name from the drop-down menu.
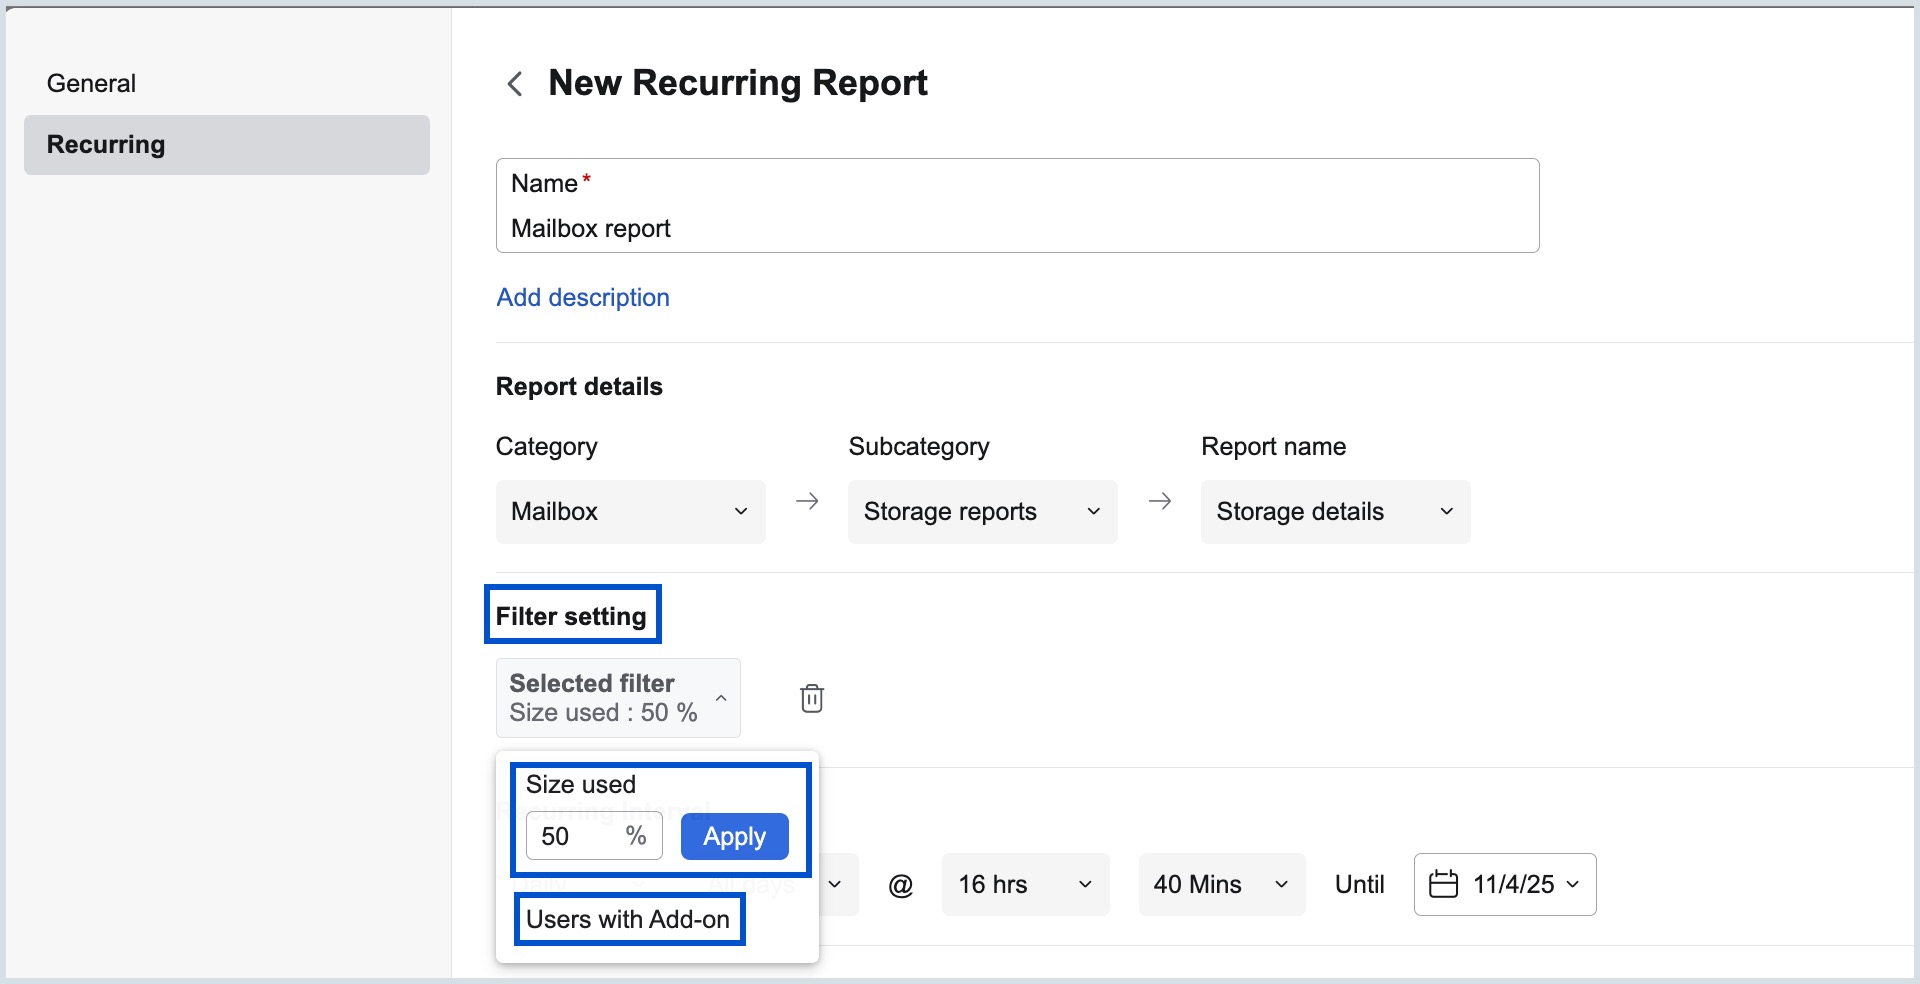
- When configuring a Recurring Report for the Mailbox section, choose the desired Filter setting, if required.
- Size used - enter the desired percentage and click Apply. Or
- Users with Add-on
- Click the Recurring Interval drop-down and choose from the below options to schedule a Recurring configuration:
- Daily - Select the All days or Weekly, time, and the end date as required.
- Weekly - Select the day, time, and end date as required.
- Monthly - Select the date of the month, time and end date as required.
- When configuring a Recurring report for Email Stats and Groups, use the Generate for option to select the required duration (Today or Yesterday) and define the time period for which the report should be generated.
- Add the email addresses in the designated field to which the report should be sent.
- Click Show Email Content to review or edit the email, then click Create to add a new recurring report configuration.
Managing Recurring Reports
- Click the Configuration icon in the left pane of the Admin Console and select Recurring.
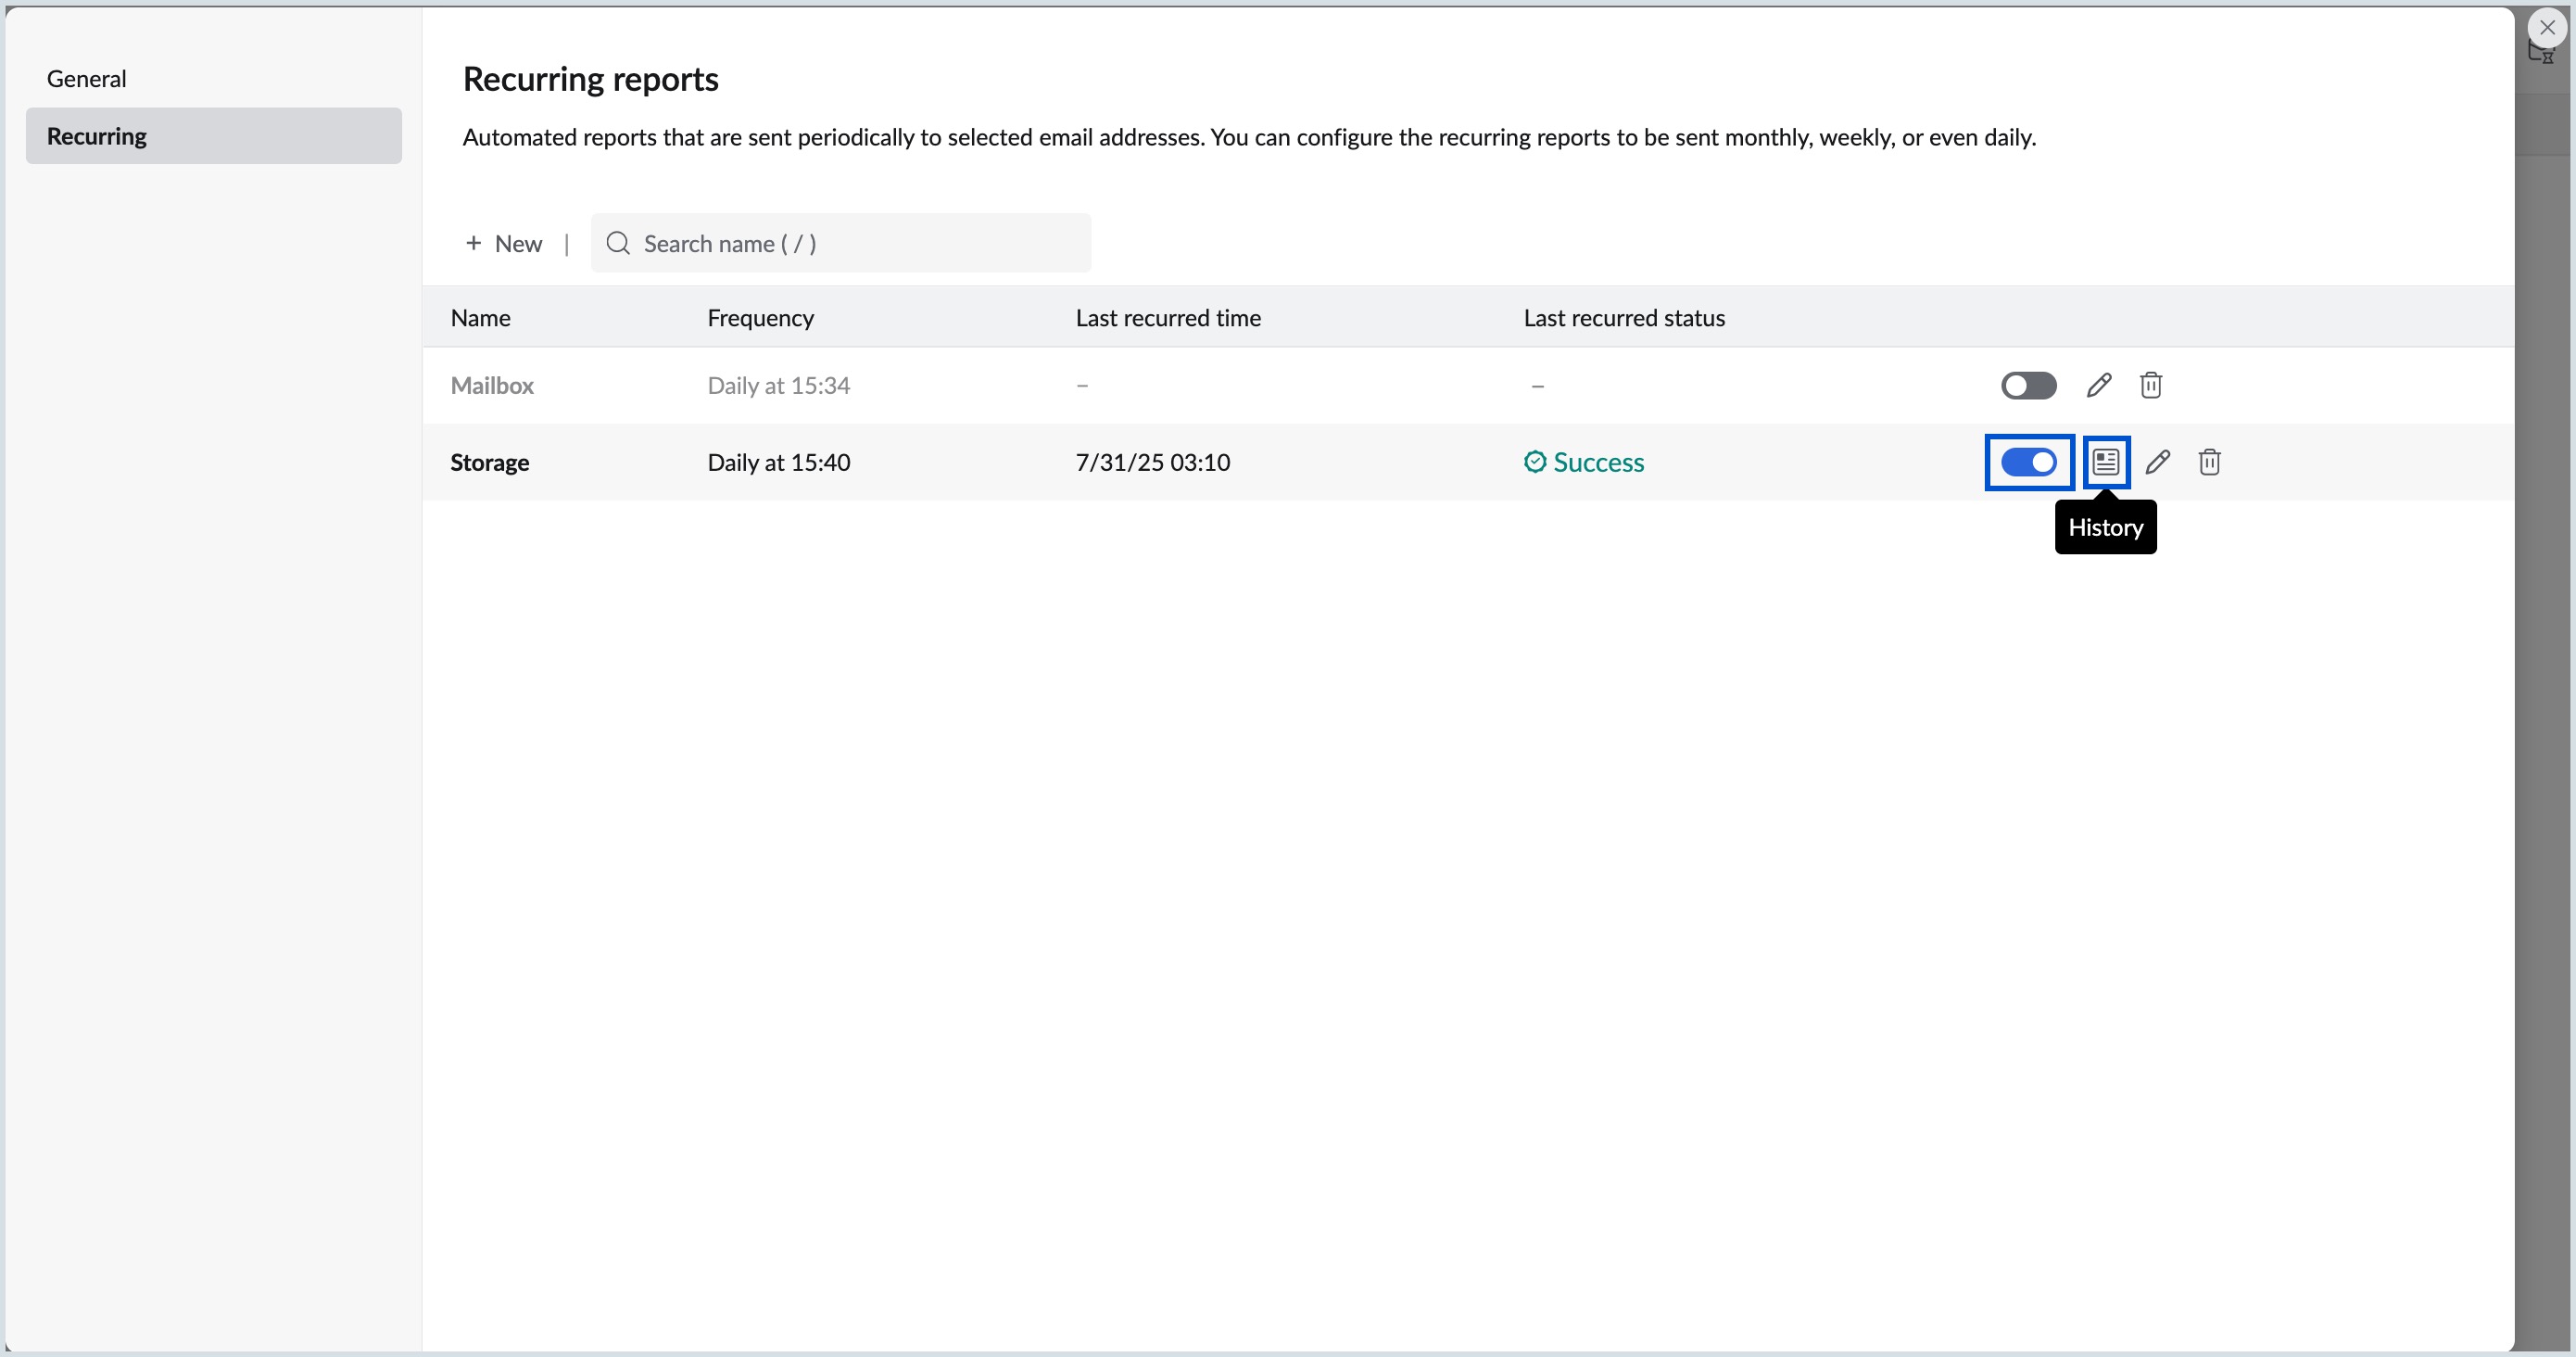
- The Recurring Reports page displays all Recurring configurations along with the following details:
- Name
- Frequency
- Last Recurred Time
- Last Recurred Status
- Use the toggle to pause or resume sending scheduled Recurring Reports.
- Click the History icon to view the report’s history.
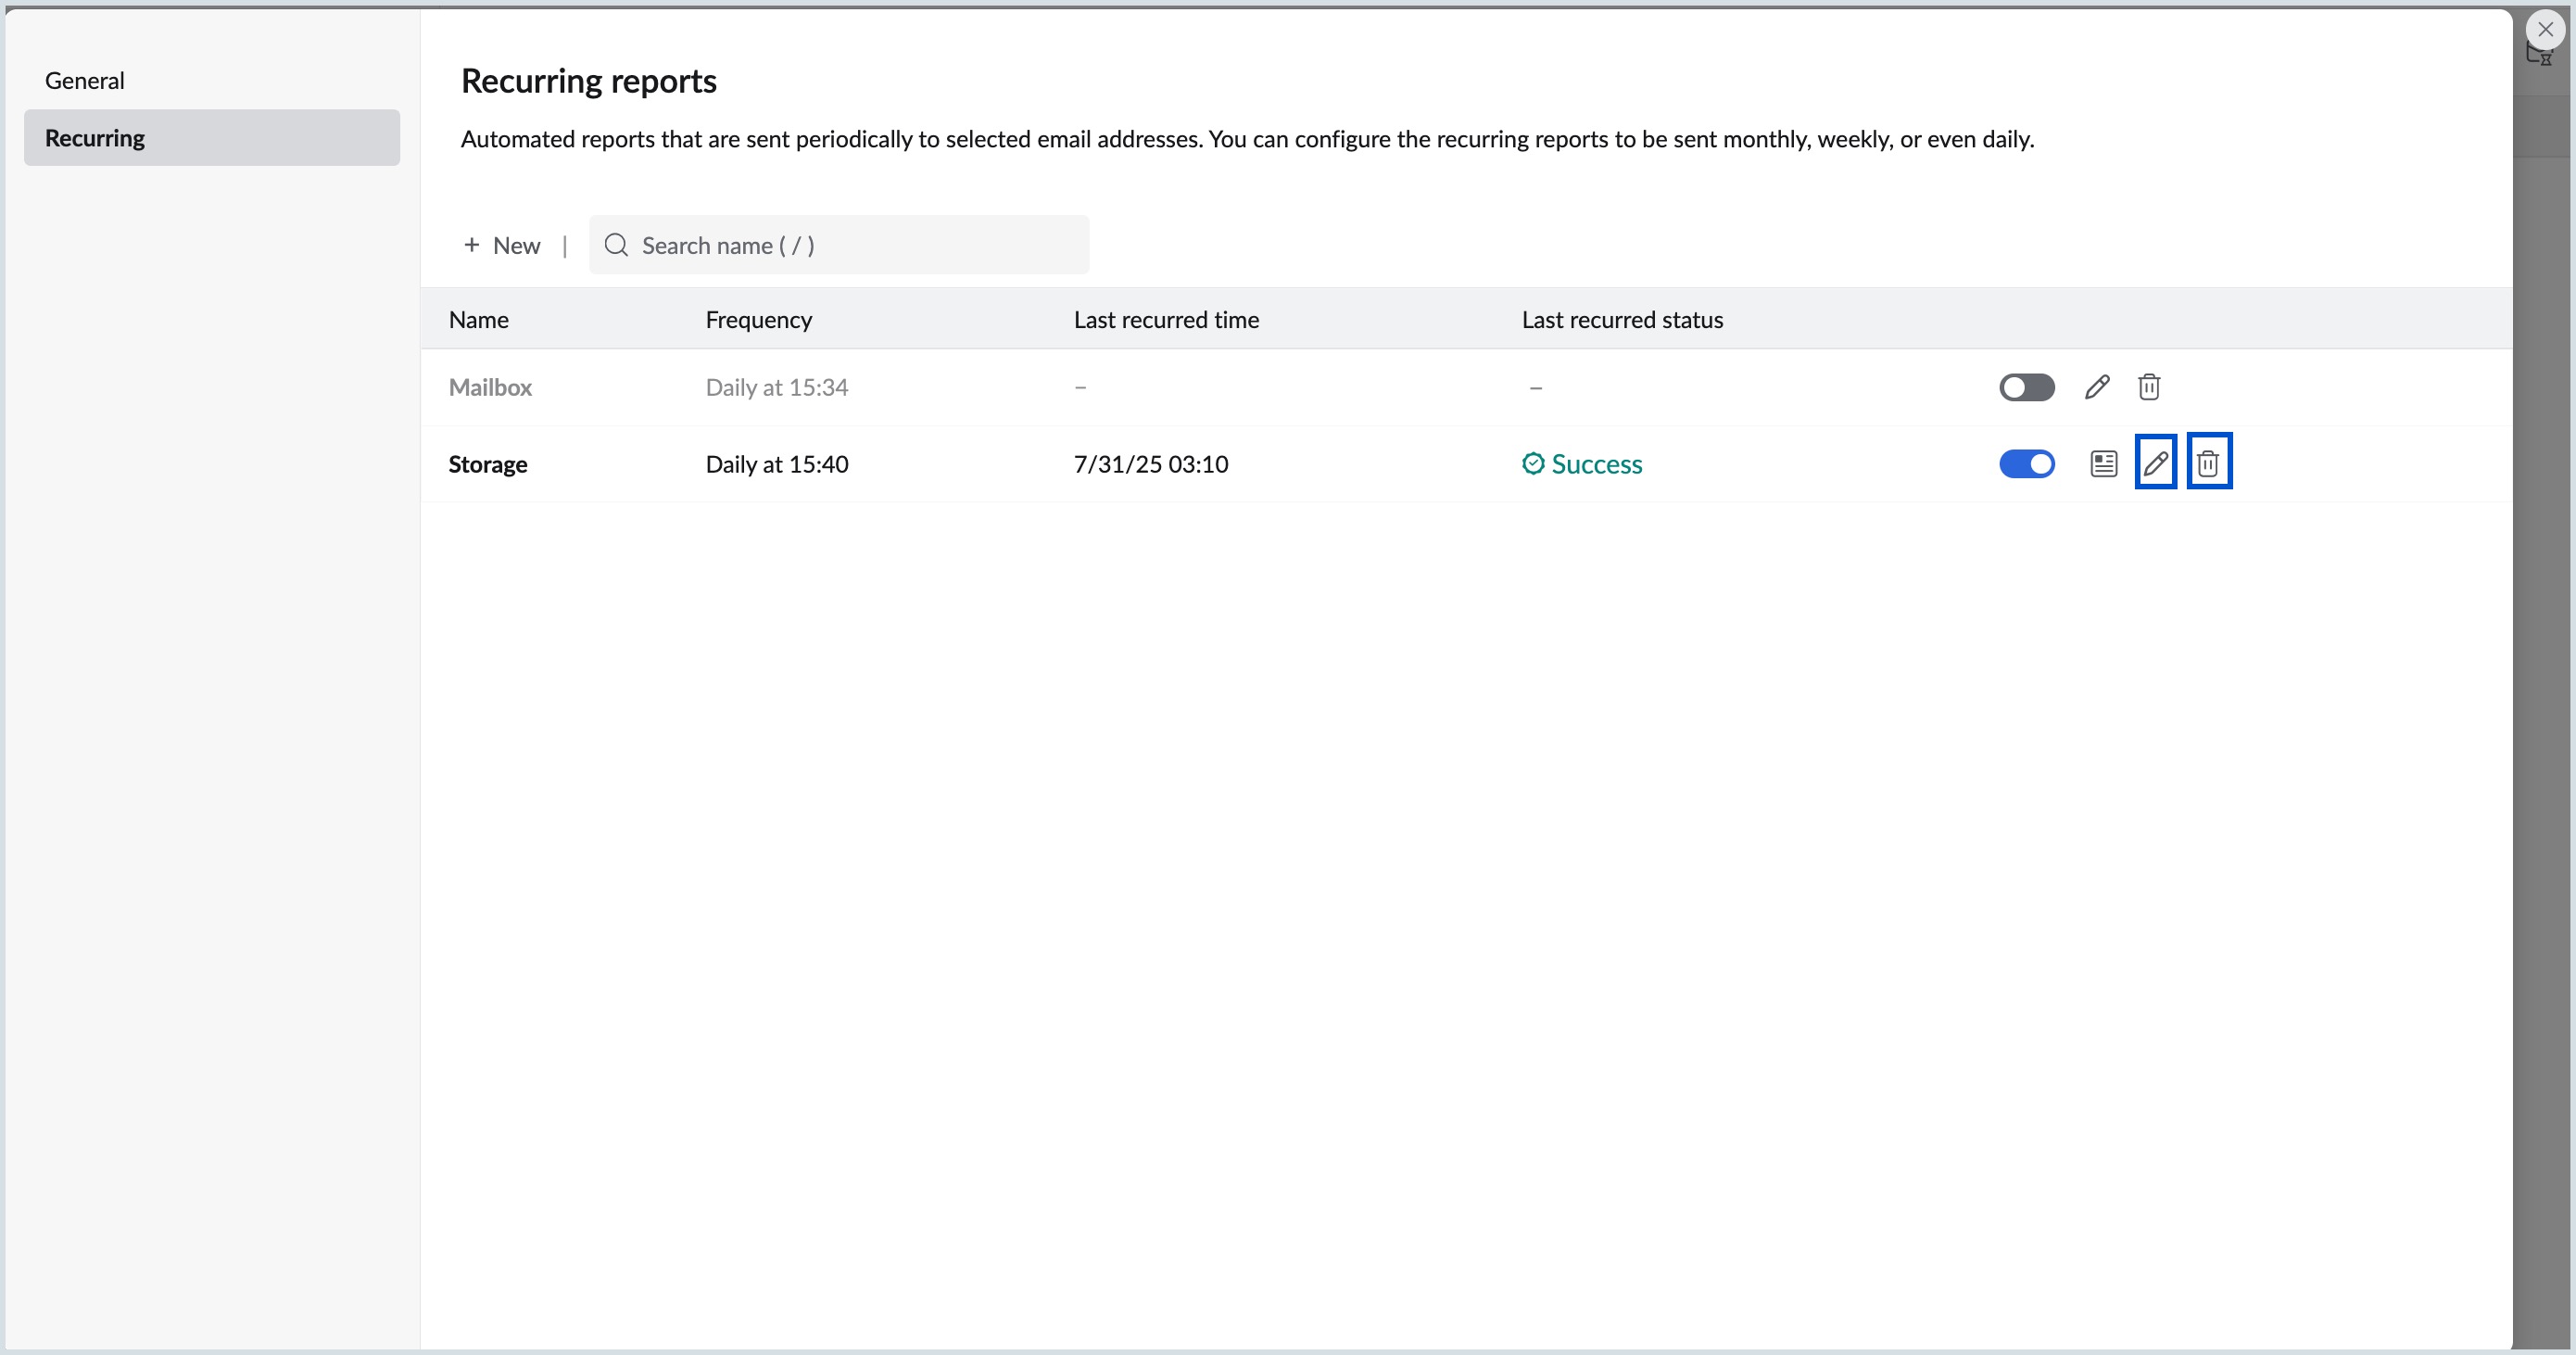
- Click the Edit icon to modify a report’s configuration.
- To delete a report, click the Delete icon and confirm deletion in the Recurring Deletion pop-up window.
Note:
- The Recurring report option is available only for organizations that use one of our paid plan.
- Recurring reports can be configured and generated only for users within the organization.
- You can configure only one Recurring report under the same category, subcategory, and report name combination.
Quick Access
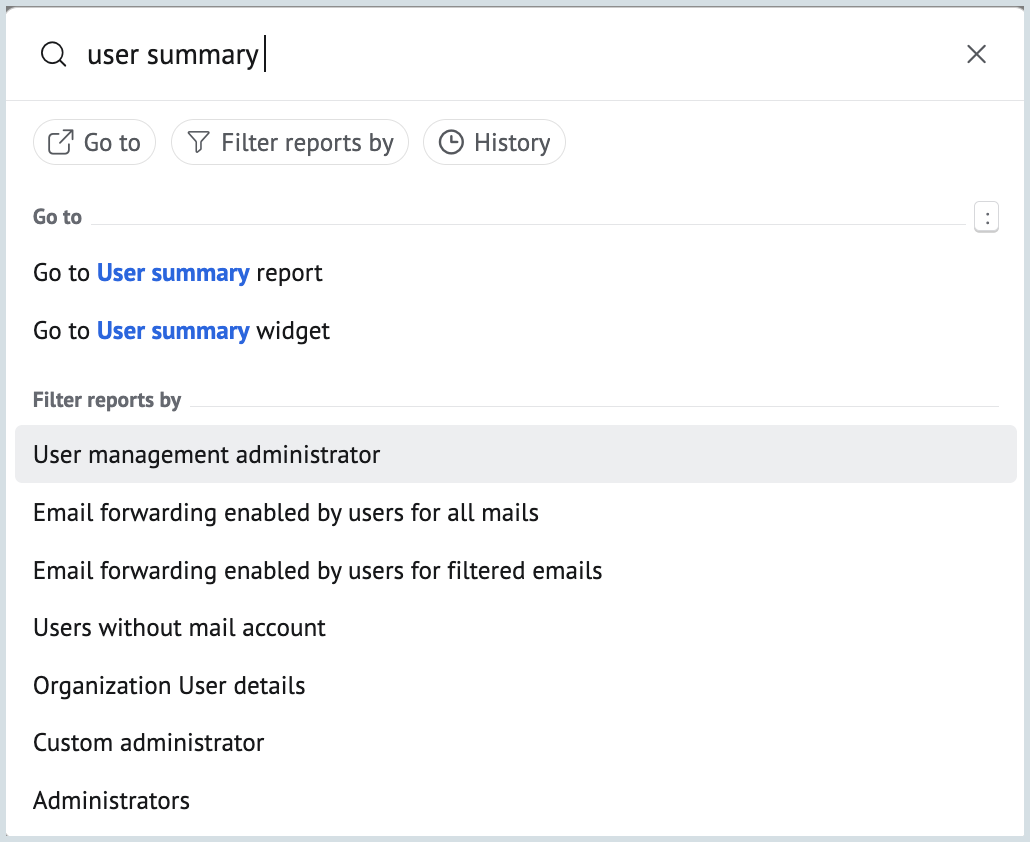
Quick Access allows you to efficiently navigate and filter reports within Admin Reports. To access it, click the Quick Access icon or press (Opt + Q) in the lower-right corner of Admin Reports.
Enter a report name or widget name in the search bar, or select the relevant query from the list. You will be directed to the appropriate window to perform the required actions. Additionally, under Quick Access, you can make use of:
- Go To: Quickly locate and access a specific report or widget based on your search query. For example, searching User Summary Report or User Summary Widget will take you directly to the corresponding report or widget within its section or dashboard view.
- Filter Reports By: Refine or narrow down report data based on specific criteria or conditions.
- History: View a history of your past search requests by clicking the History icon, which appears after you perform a search.
