Immersive Dashboards App for Zoho Analytics
The Zoho Analytics - Dashboards application is an immersive native mobile app to access and explore the business dashboards in Zoho Analytics. This app is available for Apple and Android phones, and tablets.
Benefits of the Zoho Analytics Dashboards app
- Immersive native application: An immersive purpose-built app to access, explore, and get insights on the go from your dashboards. Enjoy analytics like never before with intuitive gestures.
- Access advanced analytics - anywhere, anytime: Easily access your Zoho Analytics dashboards whenever required. Stay up-to-date with changing data trends and enjoy insightful analytics on your mobile devices.
- Powerful visualizations with a myriad of options: The Zoho Analytics dashboards app supports a wide range of interactive options through creative gestures that allows you to interact with your data and gain deeper insights. You can drill down, filter, change visuals and much more, with just a few taps.
- Filter data: Dynamically filter your data to include or exclude specific values from your visualizations.
- Ease of organization: Workspaces and dashboards are organized within an intuitive explorer for ease of access. Various contextual options allow you to sort, bookmark and search your dashboards and workspaces, and mark them as default to enhance user navigation.
- Optimized for both Android and iOS devices: Built to work seamlessly on both Android and iOS devices, with an optimized layout that adapts to every smartphone and tablet.
Note:
- Your mobile device should be connected to a network where the Zoho Analytics On-Premise is accessible in order to access reports and dashboards. When offline, you can only see the list of dashboards and workspaces, but will not be able to access them.
- The Zoho Analytics dashboards app is supported for devices with iOS 12.0 and above, and android versions 7.0 and above.
- The mobile app allows you to access and interact with your Zoho Analytics On-Premise dashboards. However, you will not be able to create new dashboards or workspaces using the app.
Getting started with the Zoho Analytics Dashboards app
The Zoho Analytics Dashboards app allows you to access analytics whenever required with an intuitive and immersive mobile app. You can view and access the reports and dashboards created in Zoho Analytics, and gain insights on the go.
Installing the Zoho Analytics - Dashboards app
This app is available for free in iOS devices running on iOS 12.0 and above, and Android devices with versions 7.0 and above.
Follow the steps below to install the Zoho Analytics Dashboards app on iOS devices.
- Open the App Store, search for the Zoho Analytics - Dashboards app and open it.
- Click the Get button, and the application will be installed automatically.
- Open the installed application, and click the Connect to On-premise link.
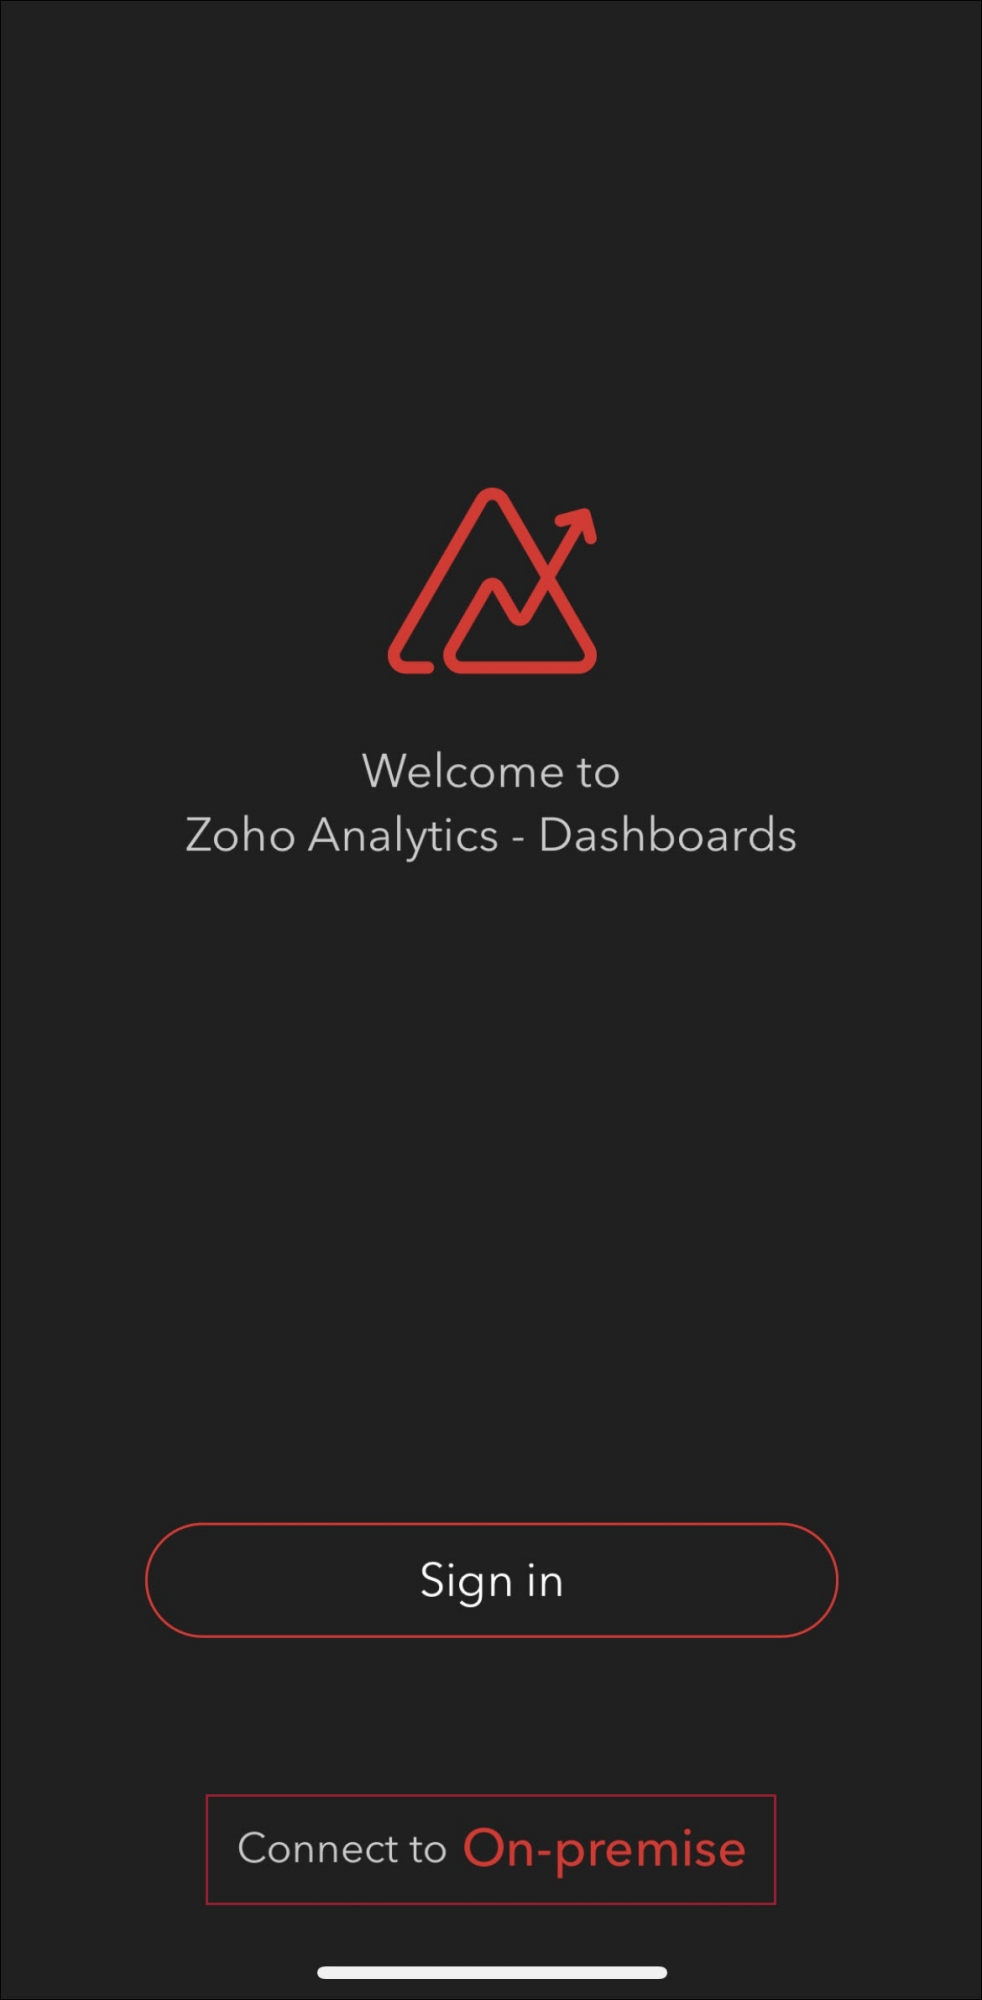
- To login to Zoho Analytics account with the application's website address, click the Website address toggle button, enter the Zoho Analytics website address, and click Connect.

- To login with the hostname, navigate to the Hostname tab, enter the hostname and port number, and click Connect.

On successful authentication, your Zoho Analytics dashboards and workspaces will be synchronized with the mobile app.
Note: Only users who have an account in Zoho Analytics On-Premise can login to this app. To download the Zoho Analytics On-Premise application, click here.
Working with the app
The Zoho Analytics Dashboards app's home screen contains three sections: Favourites, Workspaces and Dashboards. The Favourites sections displays the bookmarked dashboards and workspaces, while the Workspaces and Dashboards section displays every owned and shared workspace and dashboard respectively. You can also access your profile details by clicking the Profile icon on the top left corner, and search for specific visualizations using the search bar on the top right corner.

Workspaces
To view every workspace in your Zoho Analytics application, navigate to the Workspaces tab. The Owned and Shared tabs allow you to filter between the workspaces that you own, and those that have been shared with you.

The following operations can be carried out using the More icon that appears next to each workspace listing:
- Favorites: This icon allows you to bookmark a workspace.
- Default: The default icon allows you to configure the required workspace as a default workspace.
- Information: This icon provides the created time and the last modified time of the corresponding workspace. For shared views, you can additionally view the Created by and the Modified by details.
- Delete: This icon allows you to delete the corresponding view.

You can also sort the workspaces in ascending and descending order using the Sort icon on the top right corner.
Dashboards
To view every dashboard in your Zoho Analytics application, navigate to the Dashboards tab. The Owned and Shared tabs allow you to filter between the dashboards you own, and those that have been shared with you.

The following options are available in the Dashboards tab:
- Dynamic user filters: You can dynamically filter the values in the dashboard using the user filters listed at the top of the dashboard. Click on a user filter to view the listed values, select the required values, and click Apply.

- Drag and resize: You can easily rearrange the KPI widgets and reports in the dashboard by long pressing on the required report or widget. Drag it to the required position, and resize it as needed using the semi-circular Resize marker. Click the Done button to reflect your changes.

- Expand report: You can maximize the required report by tapping on the report name.

- Report view: To view a report, click the Open icon on the top right corner of every report. To learn more about the report view, click here.

- Cumulative analysis: When you click on any data point in a report, all the reports in the dashboard will be filtered accordingly.

- More options: The following options are available under the More icon on the top right corner of the dashboard:
- Refresh: This option allows you to refresh your dashboard to access the latest values.
- Favorites: This toggle button allows you to bookmark the dashboard.
- Information: This option lists the workspace in which the dashboard is created, and the created and modified time.
- Delete: The delete option allows you to delete the dashboards you own.

Note: You can view the dashboards in your Zoho Analytics - Dashboards app in portrait and landscape orientation. However, in landscape orientation, you can only view, sort and resize the reports in the dashboard.
Reports
You can view every report in a dashboard by clicking the Open icon on the top right corner of every report.
Charts
You can access the charts in read-only mode with the following interactive options:
- Dynamic Tooltip: You can view the chart's tooltip by tapping the corresponding data points in your chart. You can toggle between consecutive data points using the Previous and Next options. You can also filter specific values by clicking the legends listed at the top of the chart.

- Drill Down: To drill down on a value, tap the required data point, click the Drill Down option that appears, and search for the required value. Click the Undo icon to navigate back to the chart view.

- Dynamic User Filters: Use the Filter icon to dynamically filter your report using the corresponding dashboard's user filters.
- Exclude value: You can exclude a value from the report by selecting a data point in the chart and swiping it down.

- Zoom: Long press and swipe horizontally across the chart's data points to focus on each value.

- Horizontal Scroll: Lengthy charts come with a horizontal scroll bar. You can scroll the chart right to left using the scroll bar at the bottom.
- Undo: Use the Undo icon at the top right corner to reverse immediate changes.
- Cancel: This option at the top left corner allows you to cancel all changes and navigate to the original chart view.
- Back: The Back icon on the top left corner allows you to exit the report view.
Pivot, Summary, and Tabular views
You can access the pivot tables, summary and tabular views in your dashboards in read-only mode with the following interactive options:
- Dynamic User Filters: Use the Filter icon to dynamically filter your report using the corresponding dashboard's user filters.
- Resize: You can easily rearrange the rows and columns in the report by long pressing on the required row or column. Drag it to the required position, and resize it as needed using the rectangular Resize marker.

- Scroll: Swipe as required to scroll through the data in your pivot, summary and tabular views.
- Back: The Back icon on the top left corner allows you to exit the report view
More options
The following options are available under the More icon on the top right corner of the dashboard:
- Refresh: This option allows you to refresh your report to access the latest values.
- Favorites: This toggle button allows you to bookmark the report.
- Information: This option lists the workspace in which the report is created, and the created and modified time.
- Delete: The delete option allows you to delete the dashboards you own.
- Tips: This section displays the various interactions that can be carried out with the selected report.
- Change chart type: This option allows you to change the chart type, and is only applicable to chart views. Choose the required chart type and click Save to reflect the changes across both Zoho Analytics and the Zoho Analytics Dashboards app.

Commenting
The Zoho Analytics' Dashboards app offers a way to foster collaboration with both colleagues and clients. By enabling real-time commenting on a shared dashboard, users can engage in discussions about crucial business metrics to make informed decisions together.
To allow users to comment, share the dashboard with them and ensure they have the "Allow Commenting" permission. To learn about sharing and publishing your dashboard, click here.
Commenting on a dashboard
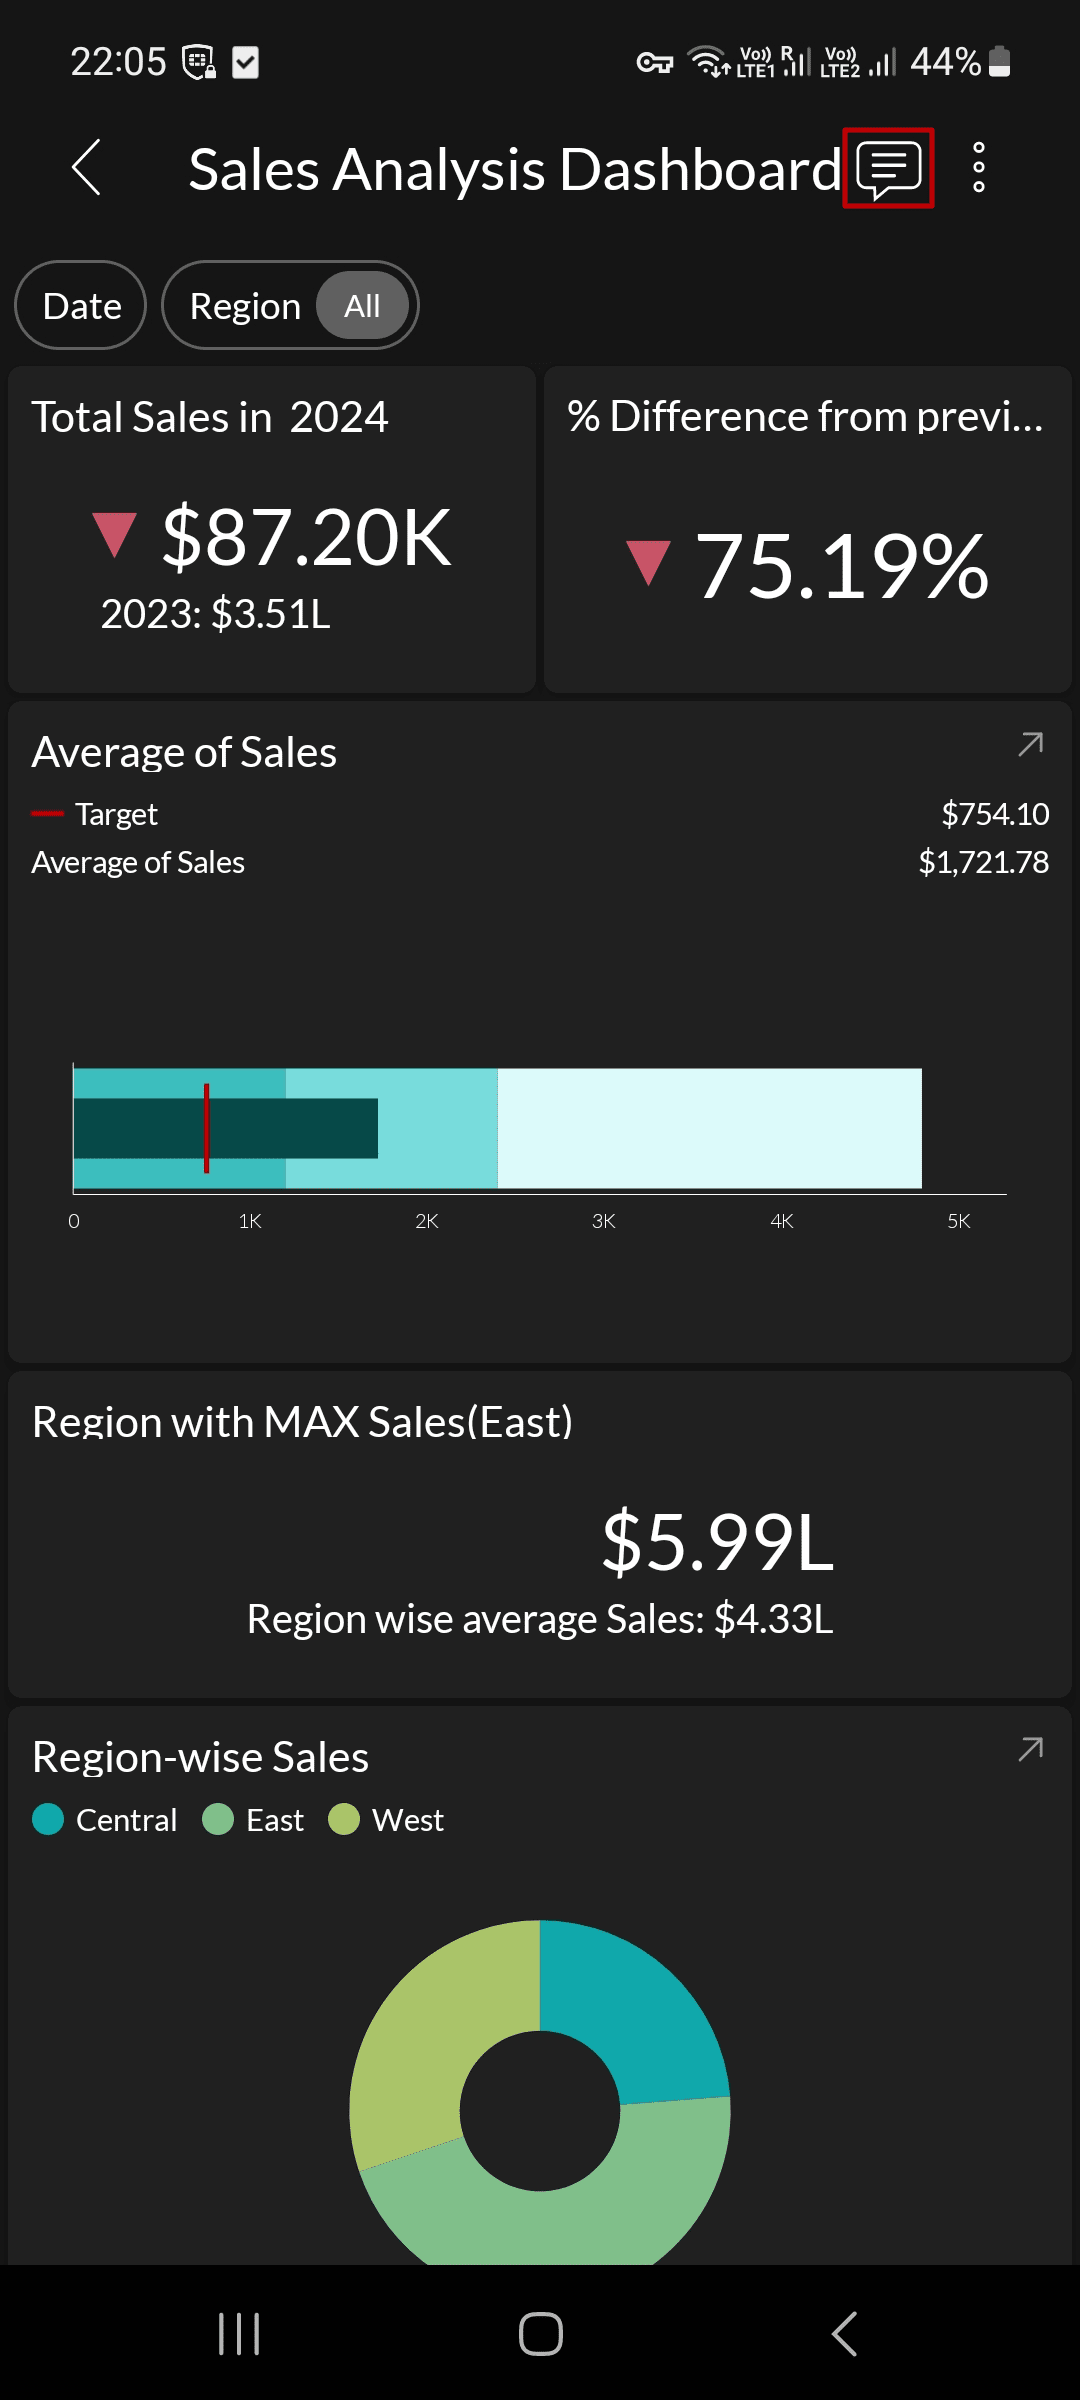
- Open the required dashboard where you want to comment.
Click the Comment icon at the top right corner of the dashboard.
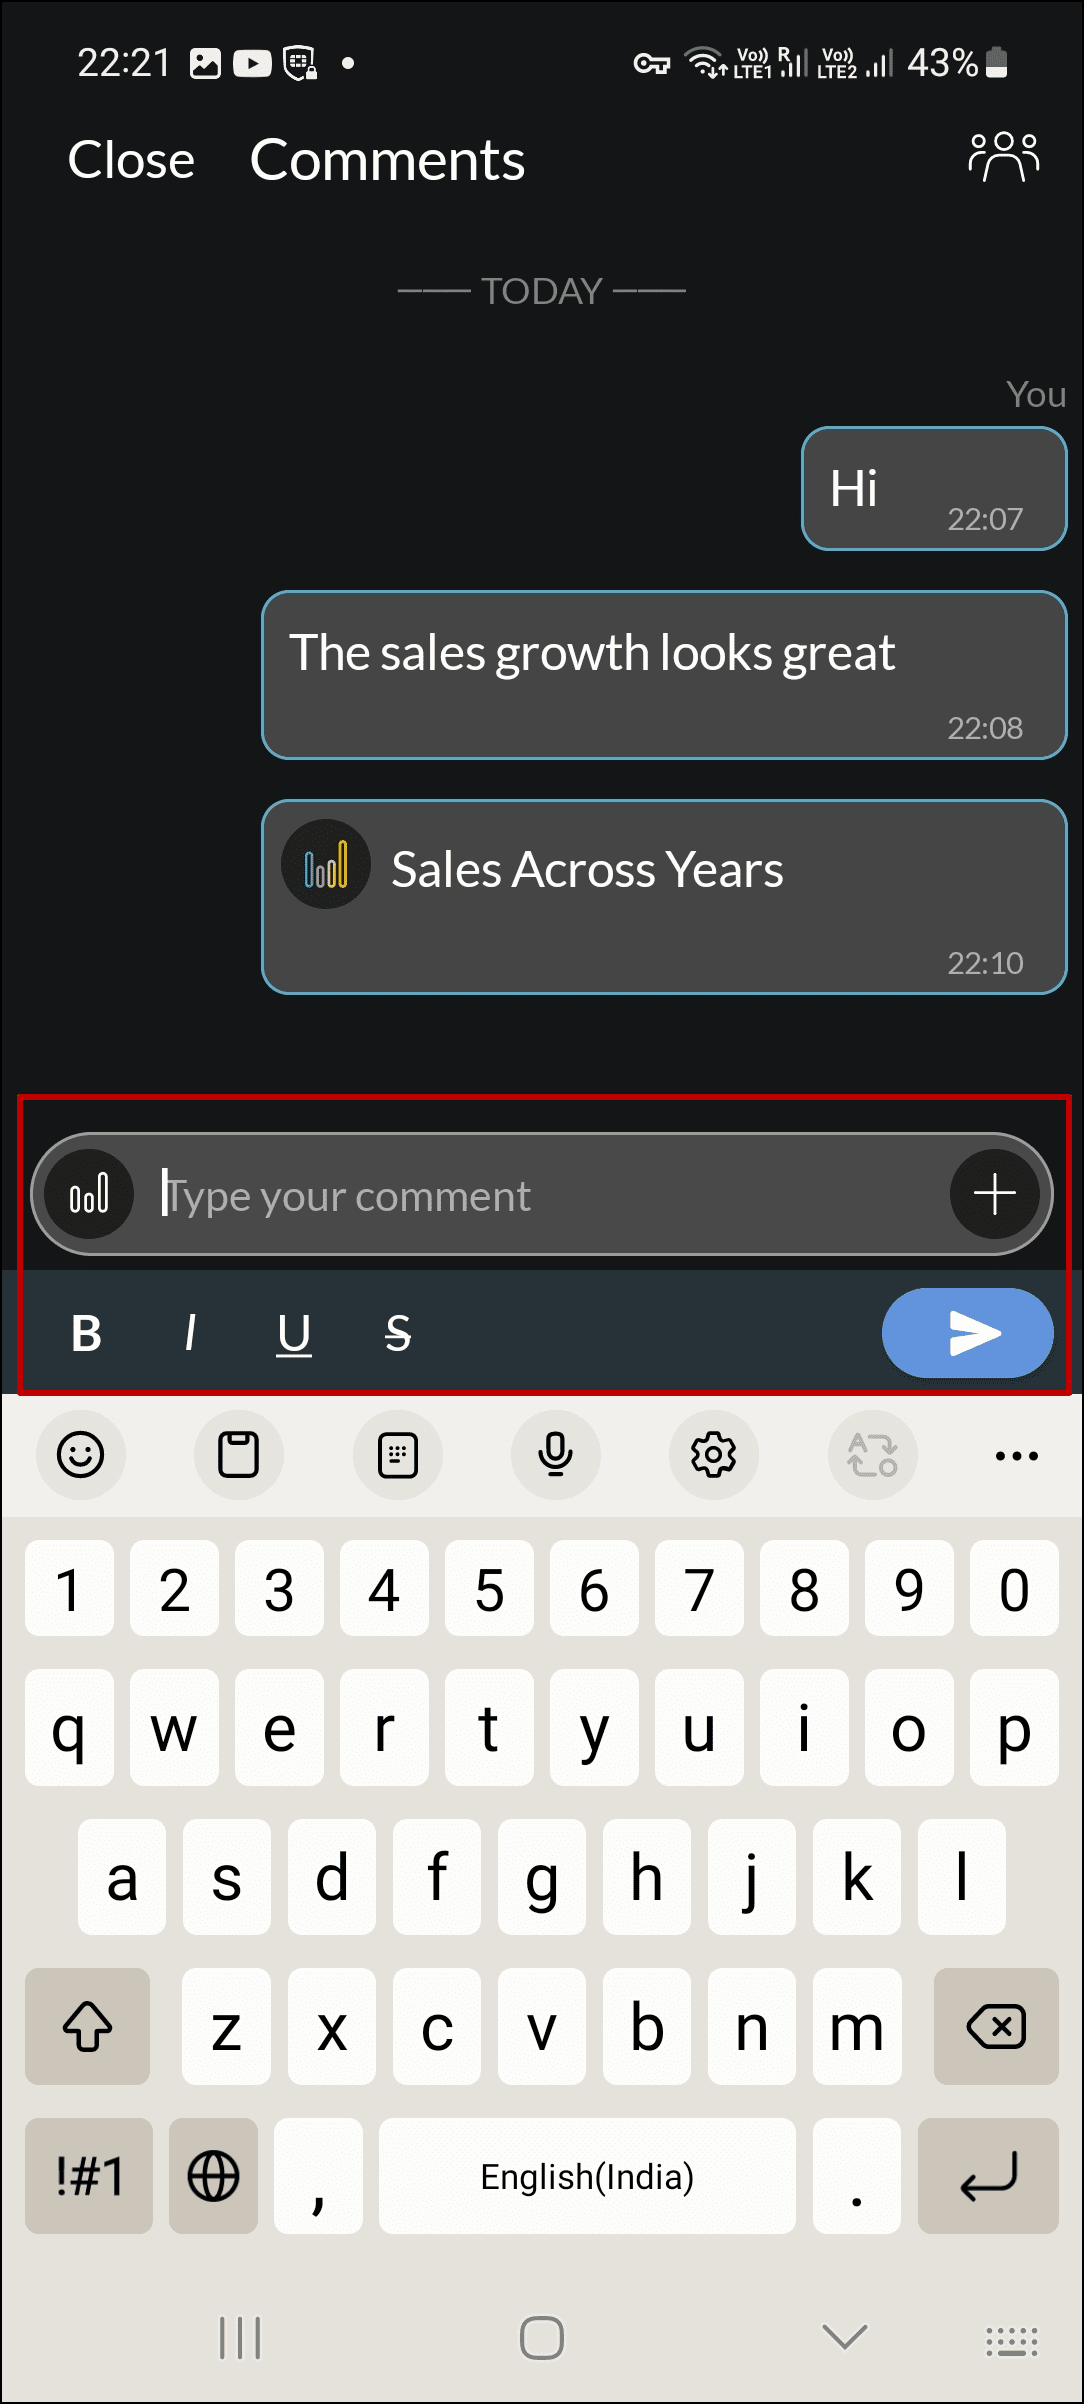
- Type your message in the Comments section. You can add emphasis to your comment using the following formatting options: Bold, Italic, Underline, or Strike-through. You can also insert an emoji, by selecting it from the emoji picker.
Click the Send button to share the comment with others. You can view comments from all the users on the comments page.
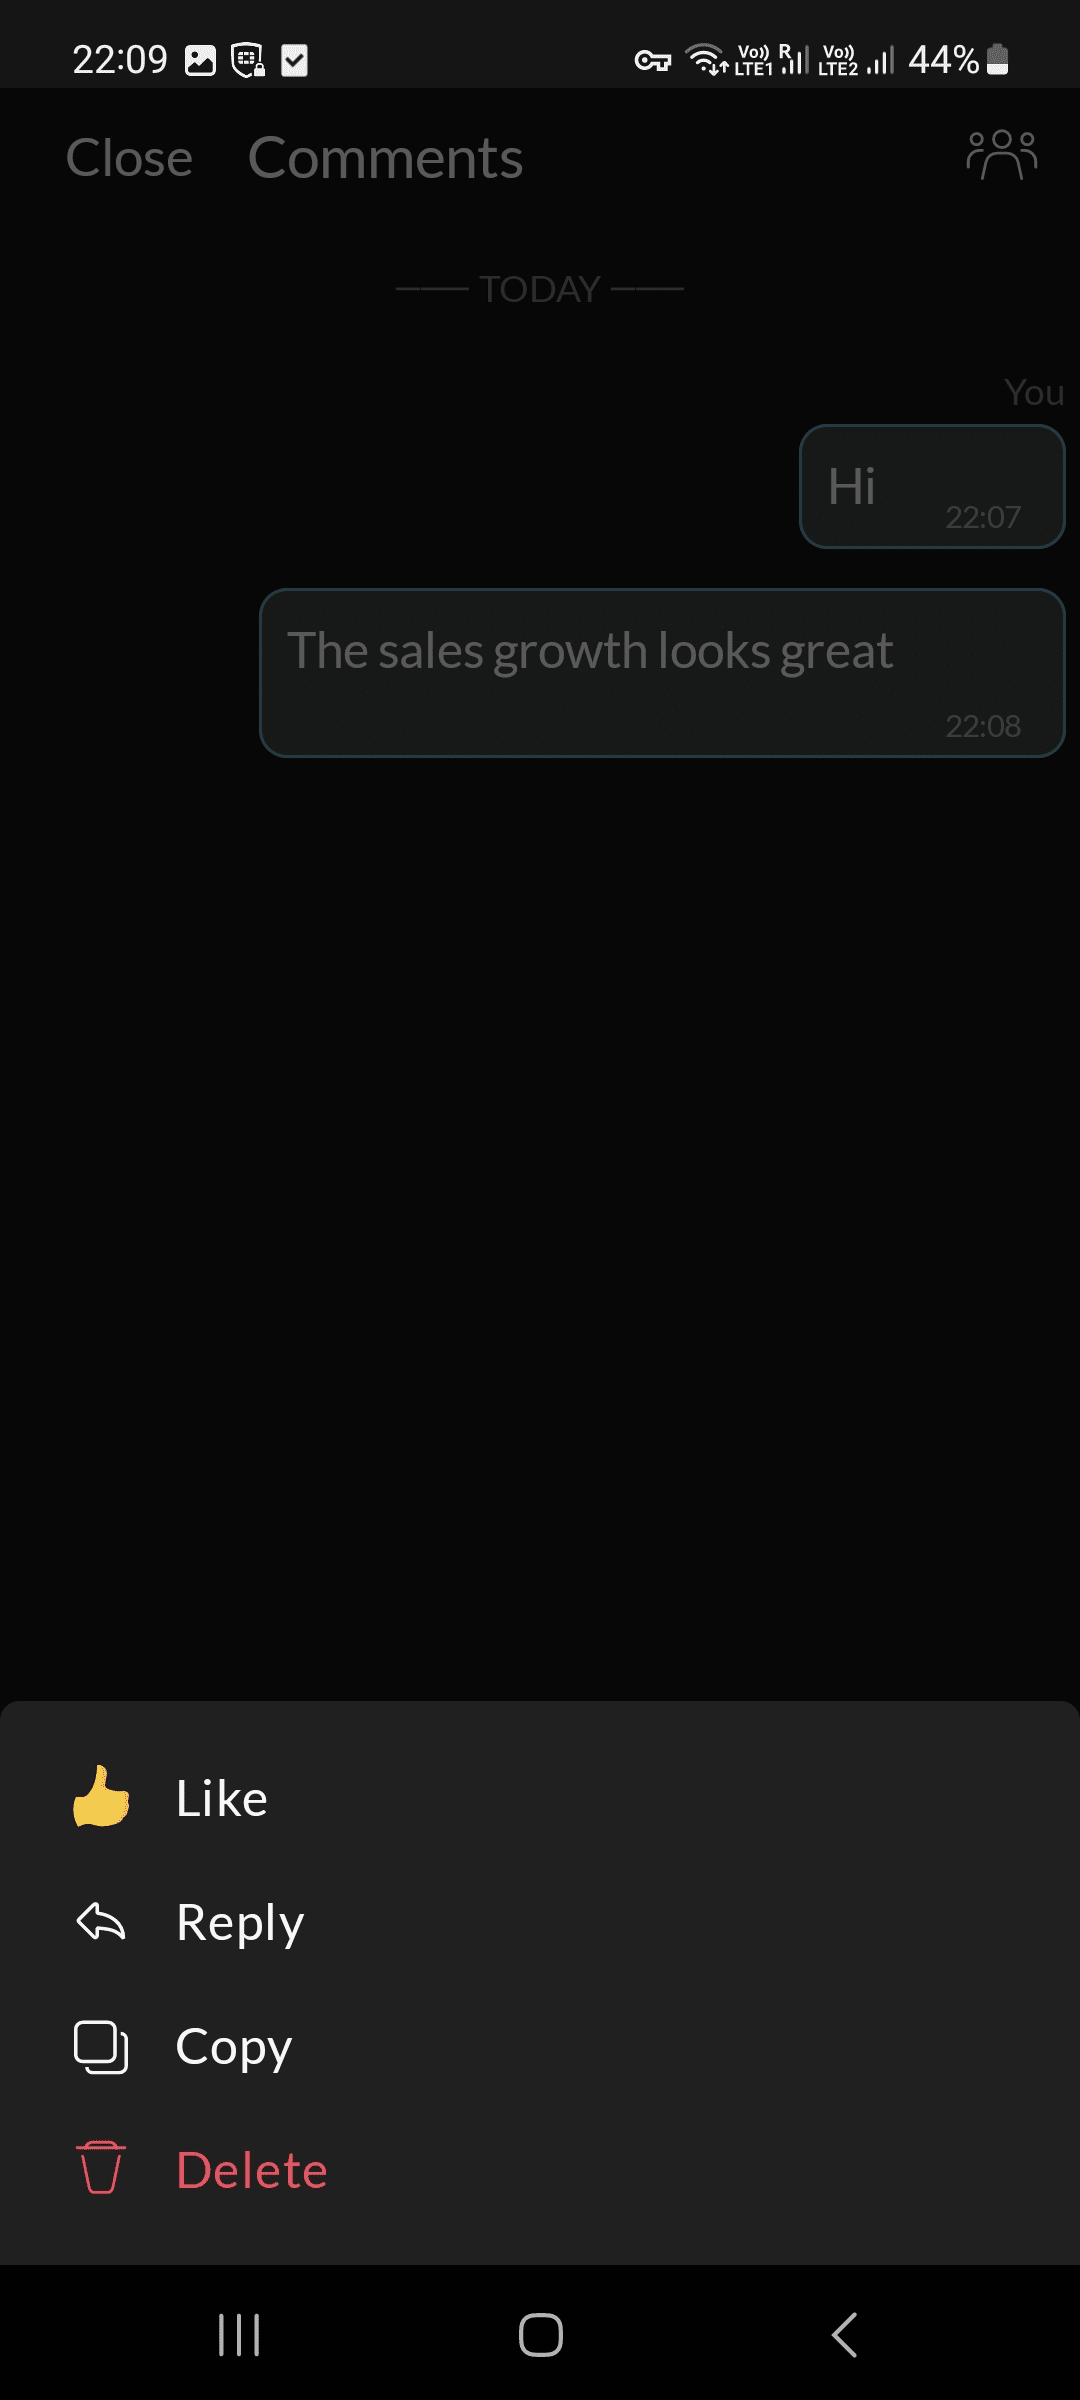
To perform actions on a specific comment, long-press on that comment. You can Like, Reply, Copy, or Delete the comment.
Adding attachments to comments
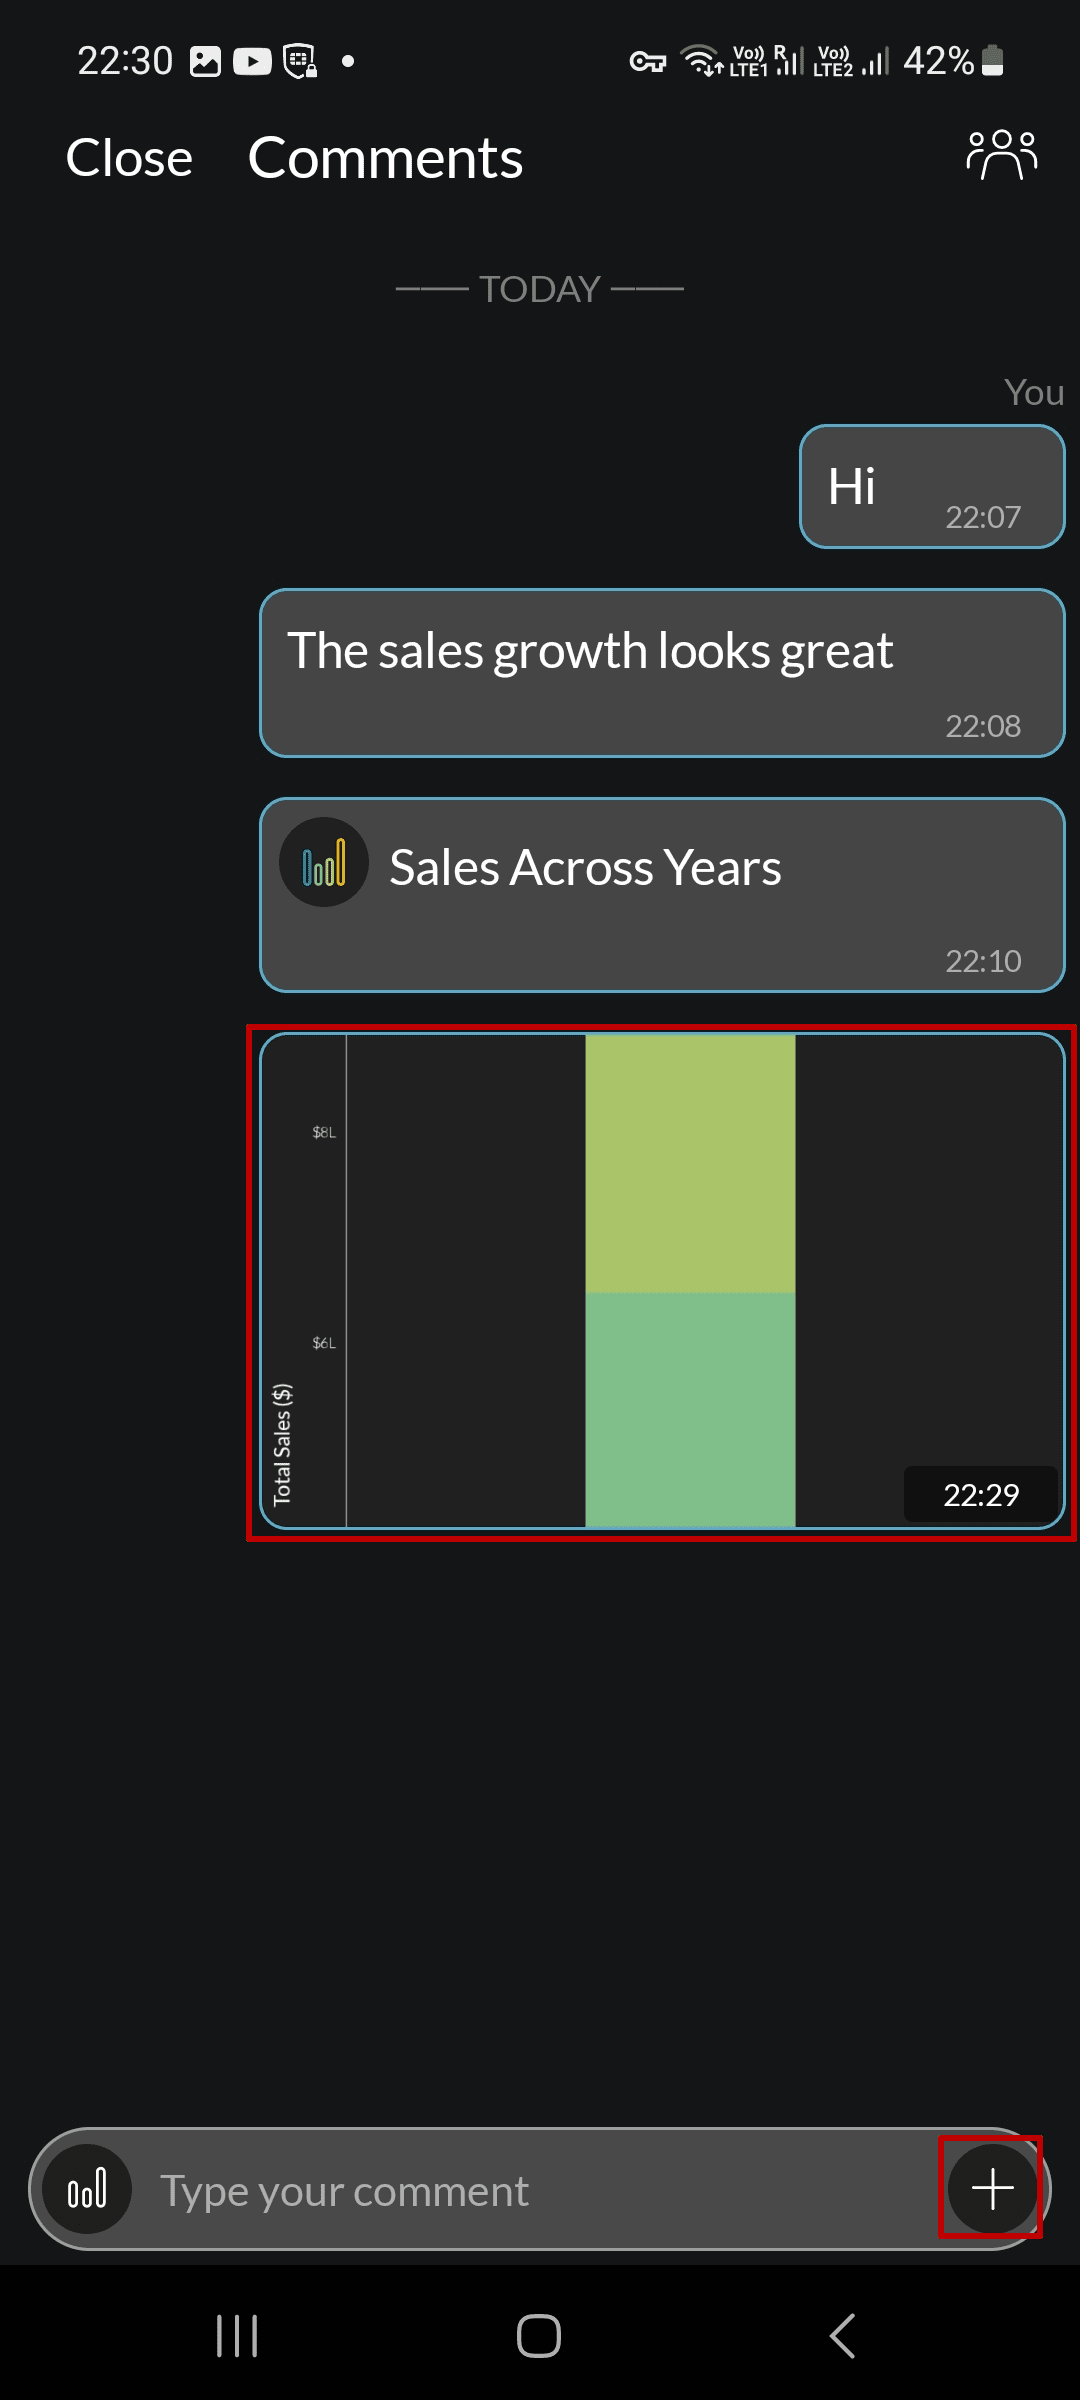
Follow the steps below to add attachments to your comments.
- From the comments page, click the + icon on the right side of the comment box.
Select and attach images, screenshots, or documents related to your comment.
Including specific dashboards and reports in comments
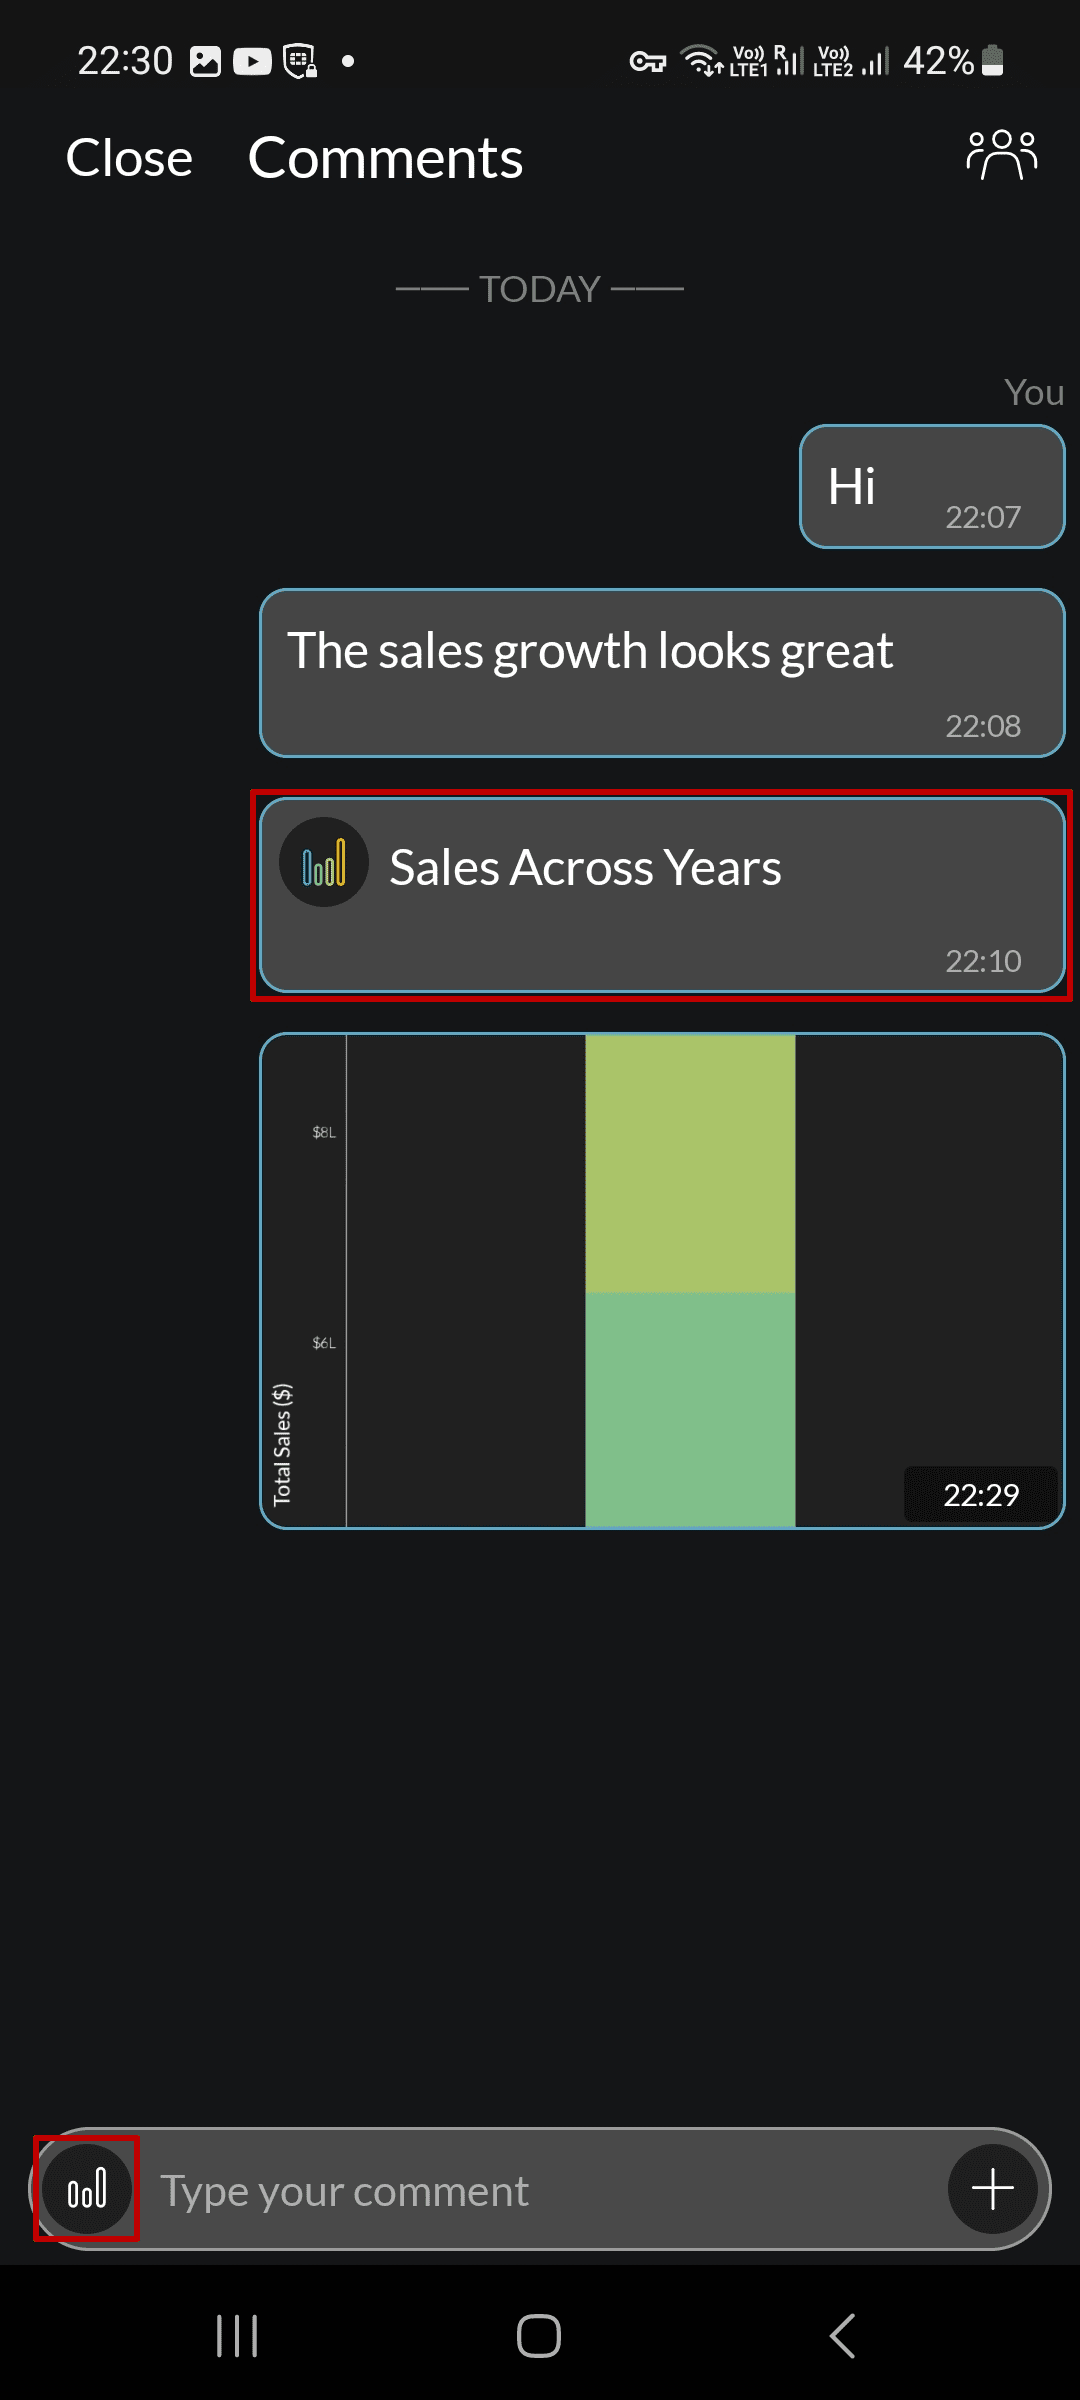
Zoho Analytics lets you include specific dashboards and reports in the comment section to enhance discussions. For this,
- Click the Reports icon on the left side.
Add the relevant dashboards and reports to your comment section.
Managing users who can comment
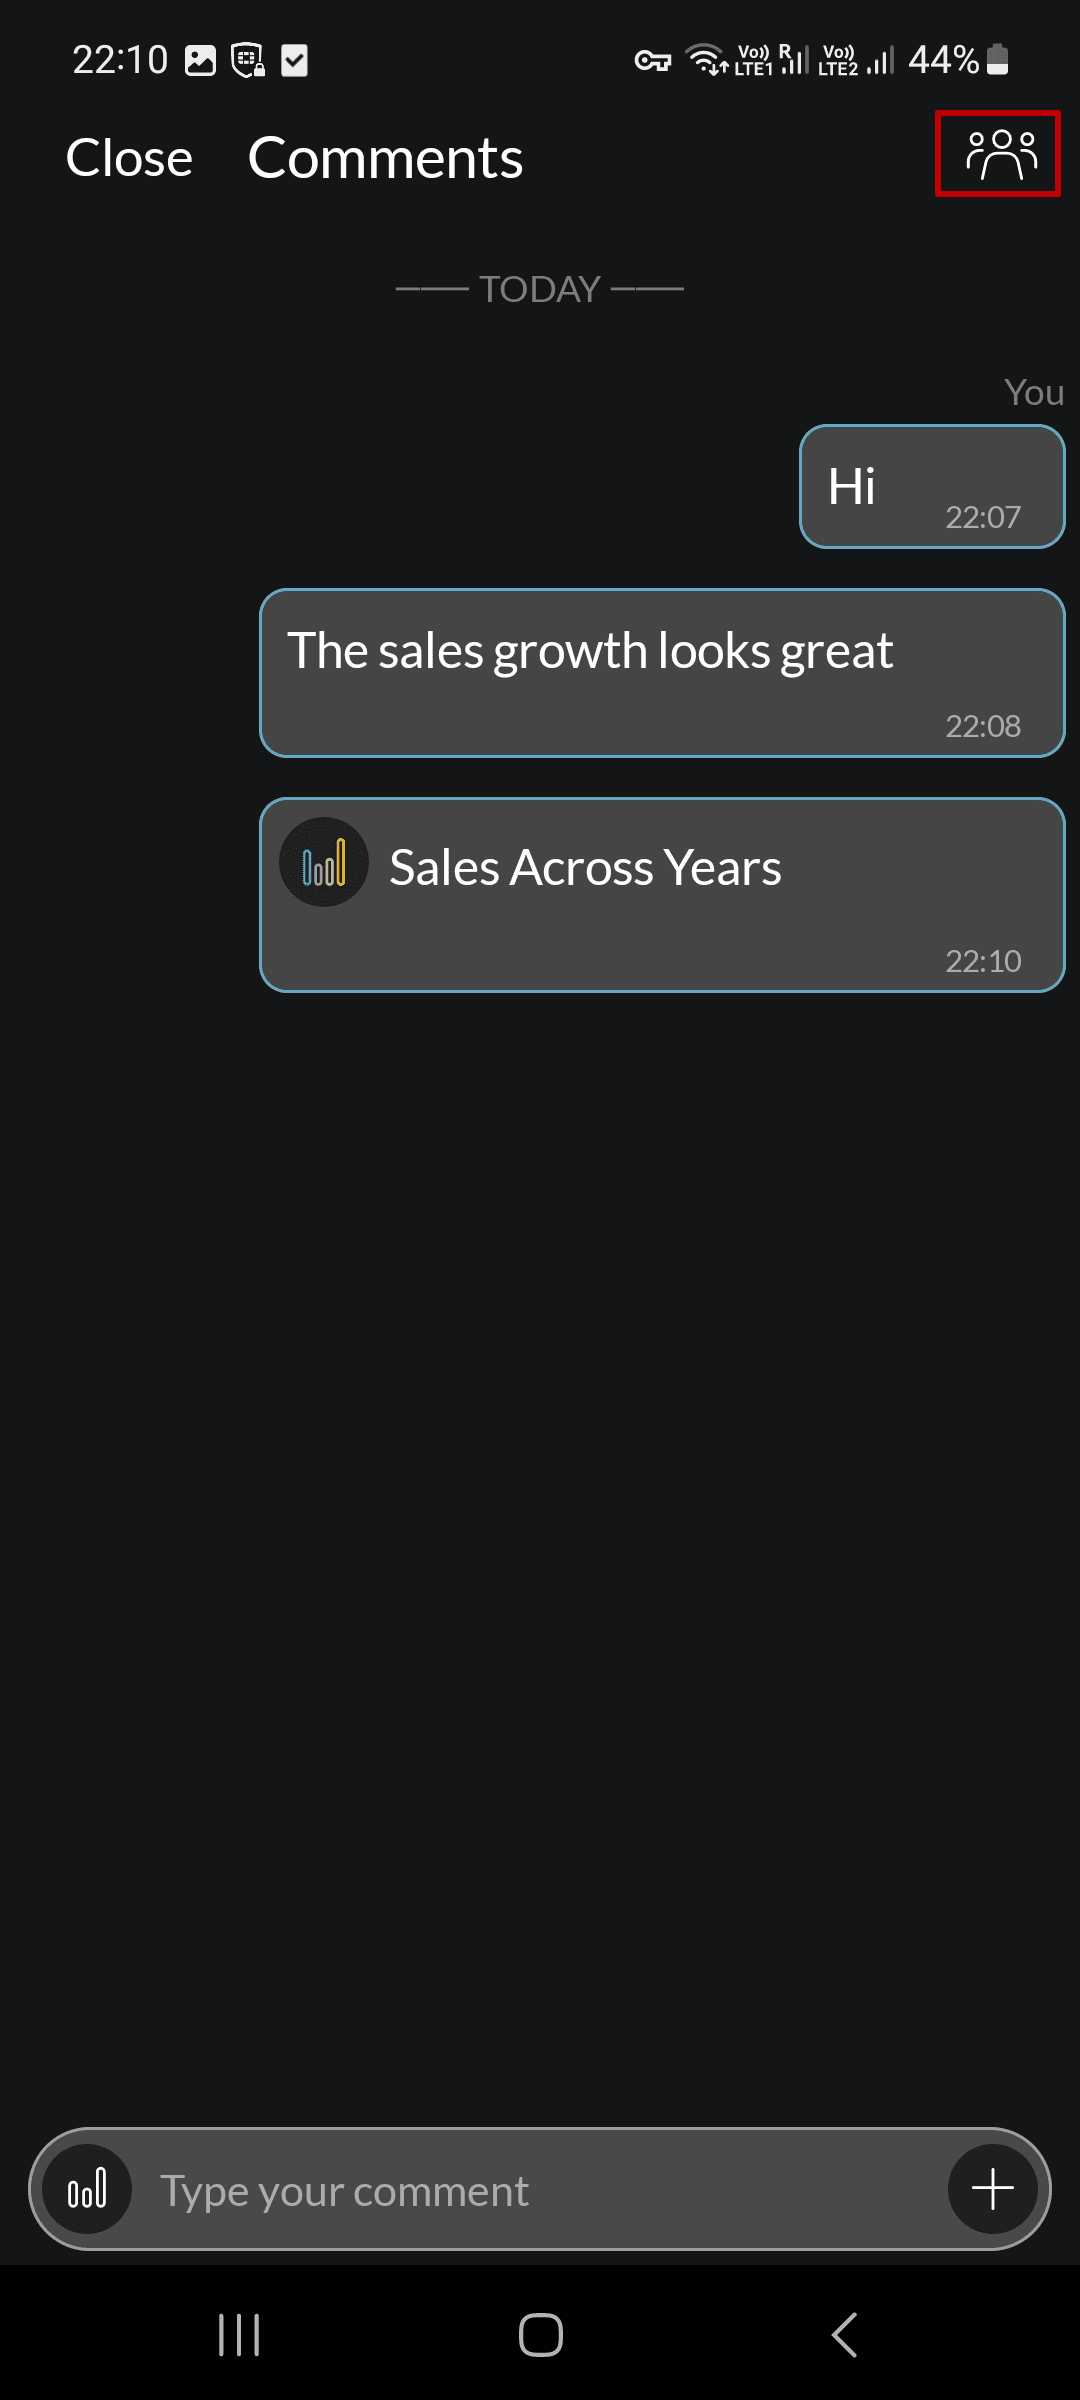
To view the list of users who can comment on your dashboard, follow the steps below.
Click the Users icon on the top right of the comments page.
Click the + icon to enable the commenting for a new user.
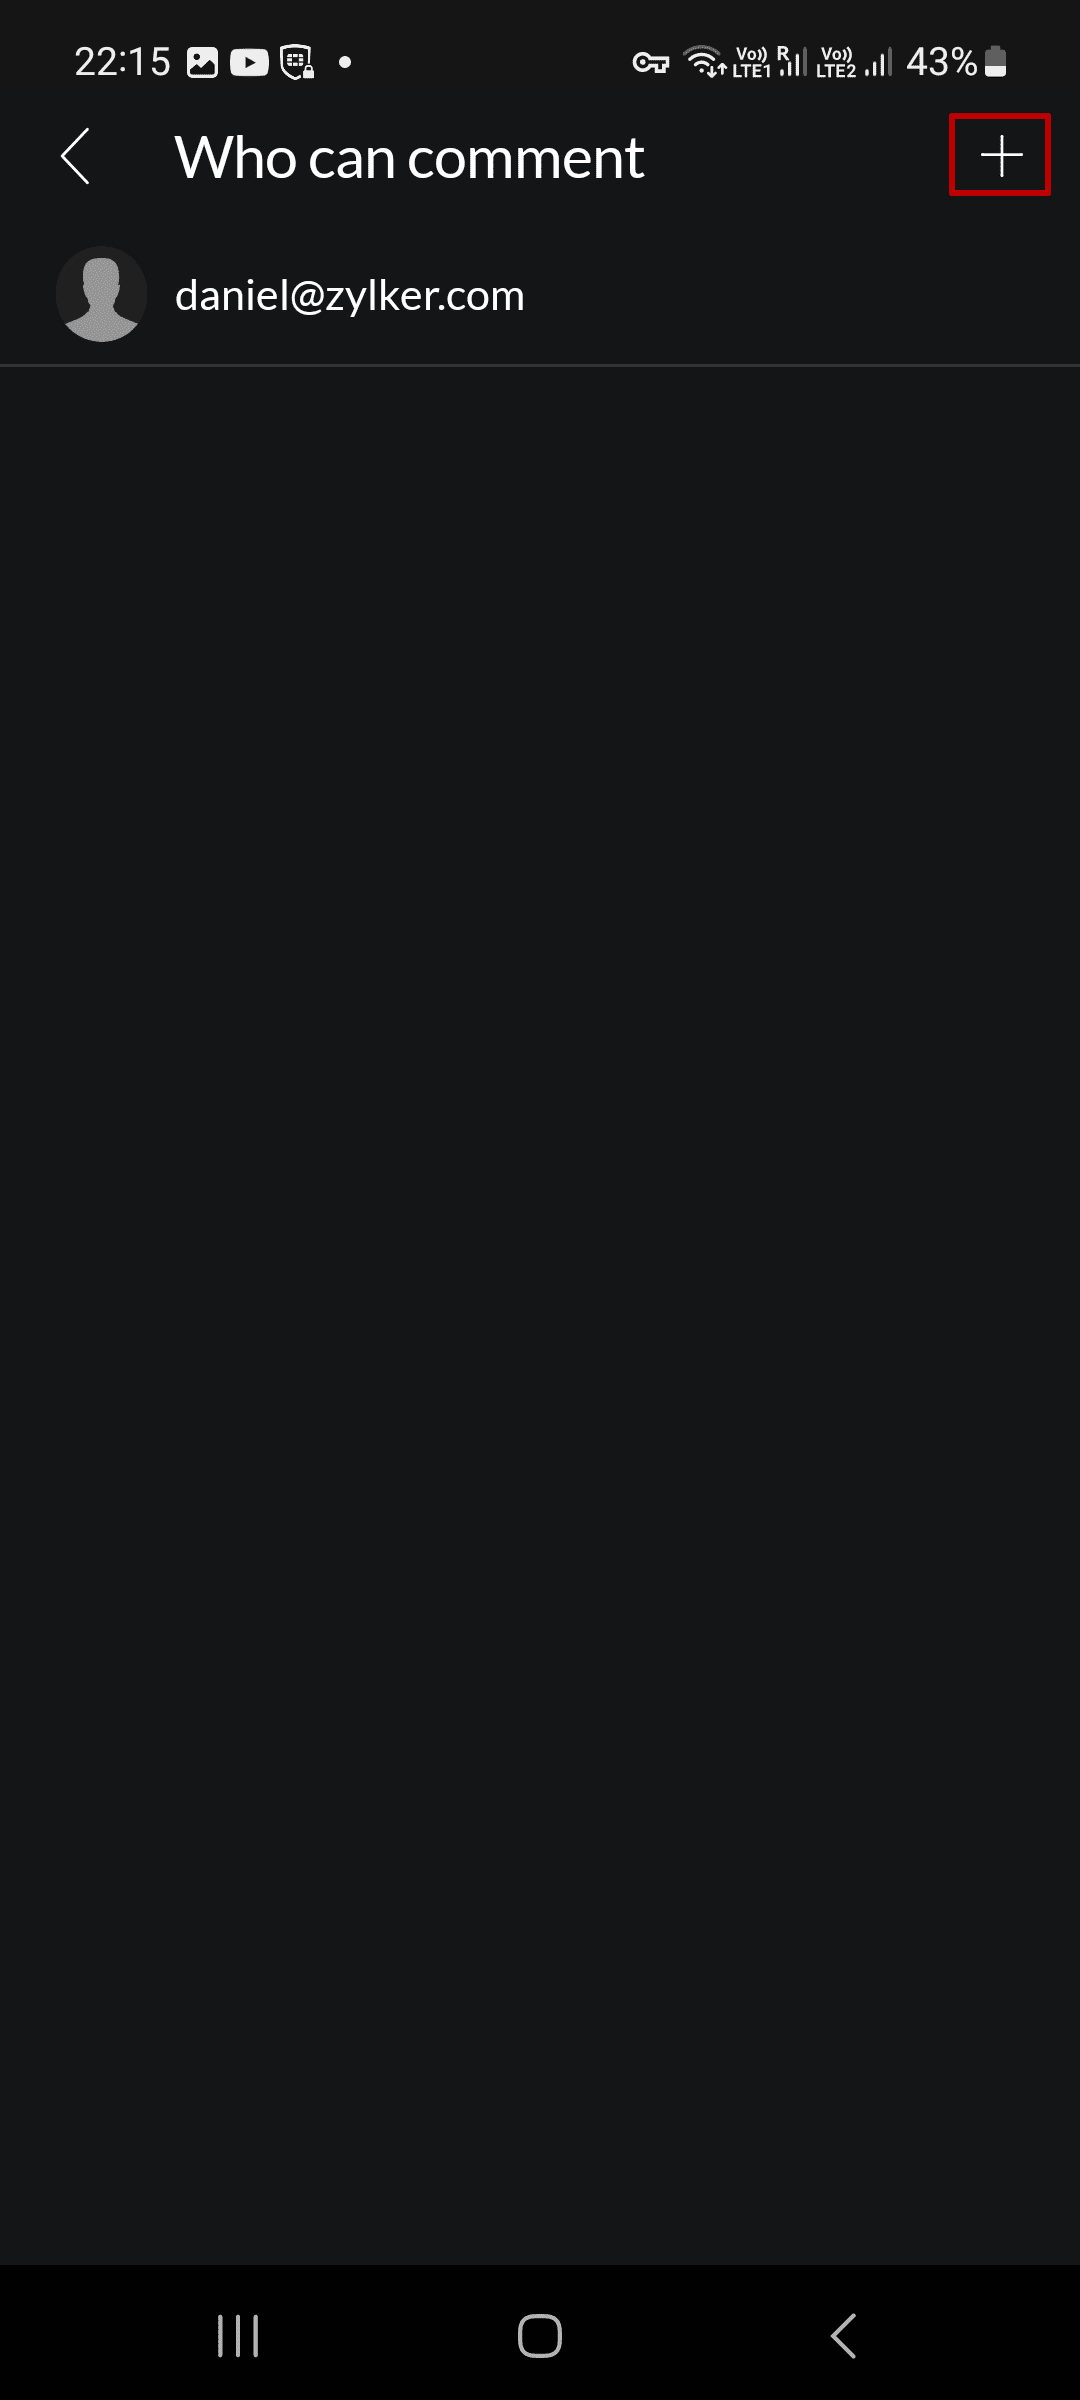
- In the page that appears, add the required users email id.
- Select Allow Commenting from the Access level section to grant commenting privileges to users.
- Click Share.

App settings
You can access the Zoho Analytics Dashboards app settings page by clicking the profile icon on the top left corner of the home page.

The following options are available:
- Default Workspace: This section lists the default workspace and allows you to modify it as required.
- Dark Theme: Use this toggle to switch between the light and dark themes for the app.
- Tips: This section provides useful interaction guidelines and mobile gestures, to interact with your dashboards and gain insightful information efficiently.
- Privacy & Security: This section displays Zoho Analytics' security policy.
- Feedback: Use this option to provide valuable feedback.
- About: This section lists an overview of the Zoho Analytics Dashboards app.


