Auto Analysis
Auto Analysis capability in Zoho Analytics helps you go from raw data to insights in minutes.
Zoho Analytics uses generative AI, machine learning, and natural language processing techniques to understand the meta information and schema of the data and then generate reports and dashboards.
The large volume of data makes it challenging to decide from where to begin the analysis. The auto analysis feature serves as a guiding tool, directing towards the most important aspect of the data. Simplifies the data analysis process, making it easier for people with limited technical expertise.
It saves a significant amount of time spent understanding the high volume of data and creating reports. This capability is highly - customizable according to the analytical needs in Zoho Analytics.
Zoho Analytics provides the following auto analysis options that would help you get accurate - insightful reports and dashboards with just the ease of a single click.
- Auto Analysis: You can automatically generate reports and dashboards for a table in Zoho Analytics without much effort on your part. You can customize the reports later if required.
- Similar to Another Table: You can generate similar reports and dashboards for a table similar to an existing table within a workspace in Zoho Analytics.
- Ask Zia: You can ask questions in natural language, and Ask Zia will understand the intent and generate the most relevant reports as answers to you. The additional burden on the users to understand the data structure to create reports and dashboards is removed. They need to just ask questions to get insights as answers instantly.
On this Page
- Who can Auto Generate Reports and Dashboards?
- Auto-generate Reports and Dashboards
- Auto Analysis for Multiple Tables
- Similar to Another Table
- Troubleshooting Tips
Who can Auto Generate Reports and Dashboards?
Users with administrator privileges (Account Admin, Org Admin and Workspace Admin) and any custom role users with the permission to create reports, dashboards,folders and formula columns can auto generate reports and dashboards.
Auto-generate Reports and Dashboards
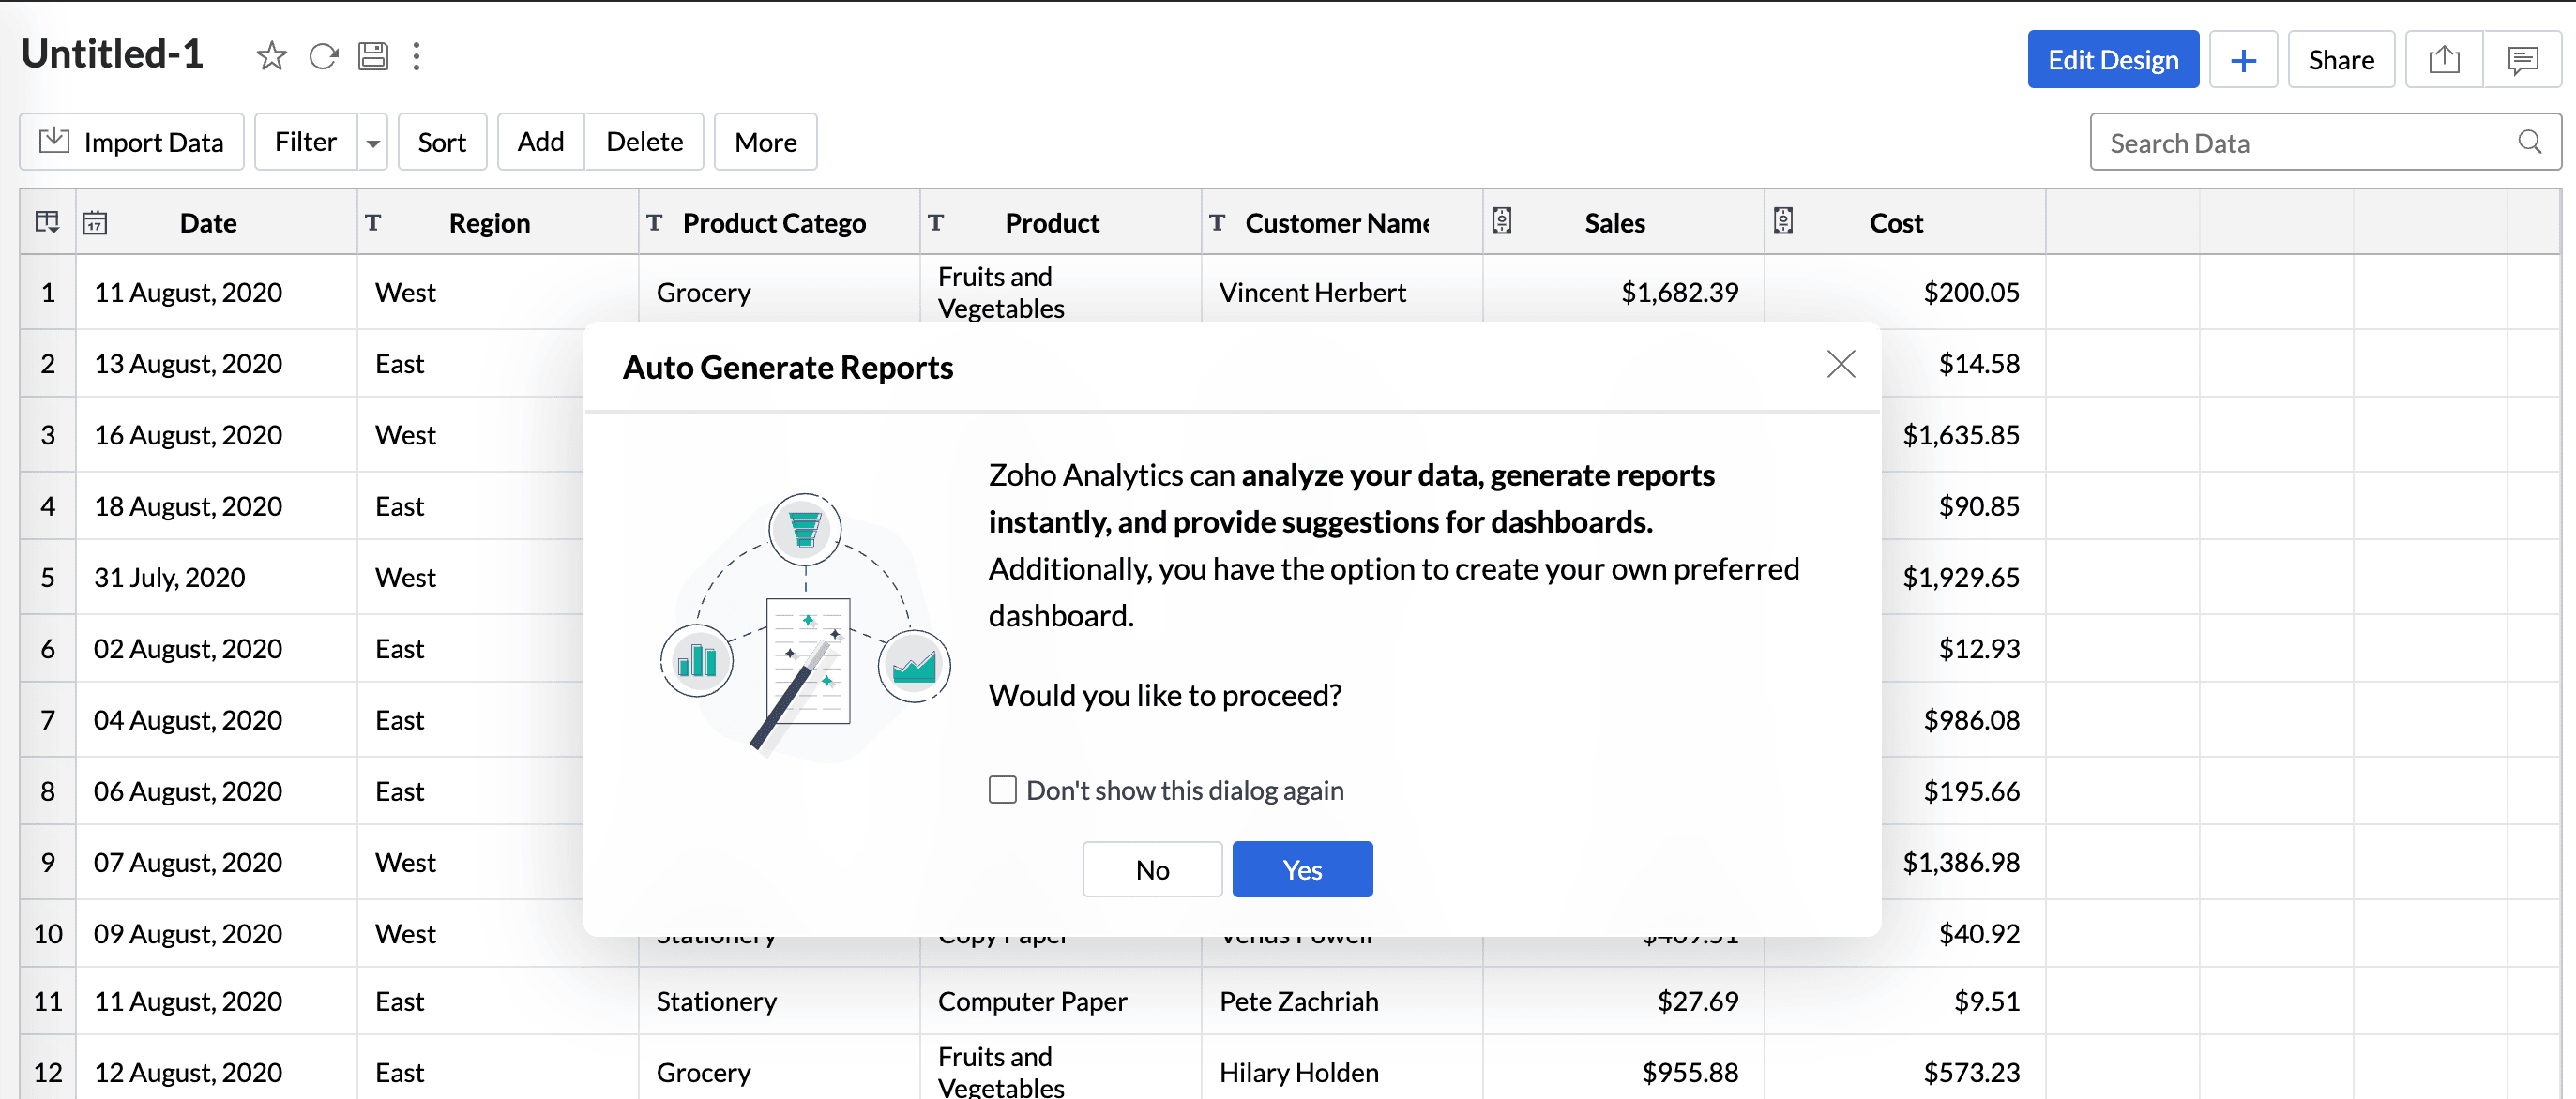
- Once you import the necessary tables for analysis into Zoho Analytics, a dialog will be displayed asking for your permission to auto generate reports and dashboards. Click Yes.
- Our generative AI-powered analytical assistant, Zia, will analyze the schema of the data and select the important metrics, dimensions, and date columns and then generate reports. The dashboards are categorized based on the functionalities.
- Click Preview to get a glimpse of the reports that will be a part of that specific dashboard.

- Click the info icon to view the list of functions applied to the data. Functions applied to Metric columns are highlighted in dark blue, and the Dimension columns are highlighted in aqua blue.
- Zoho Analytics allows you to Customize the Columns that should be used for analysis. The columns are listed based on the data type. Click Add Column to include columns for analysis, and click the remove icon to exclude a column from being used in the report.
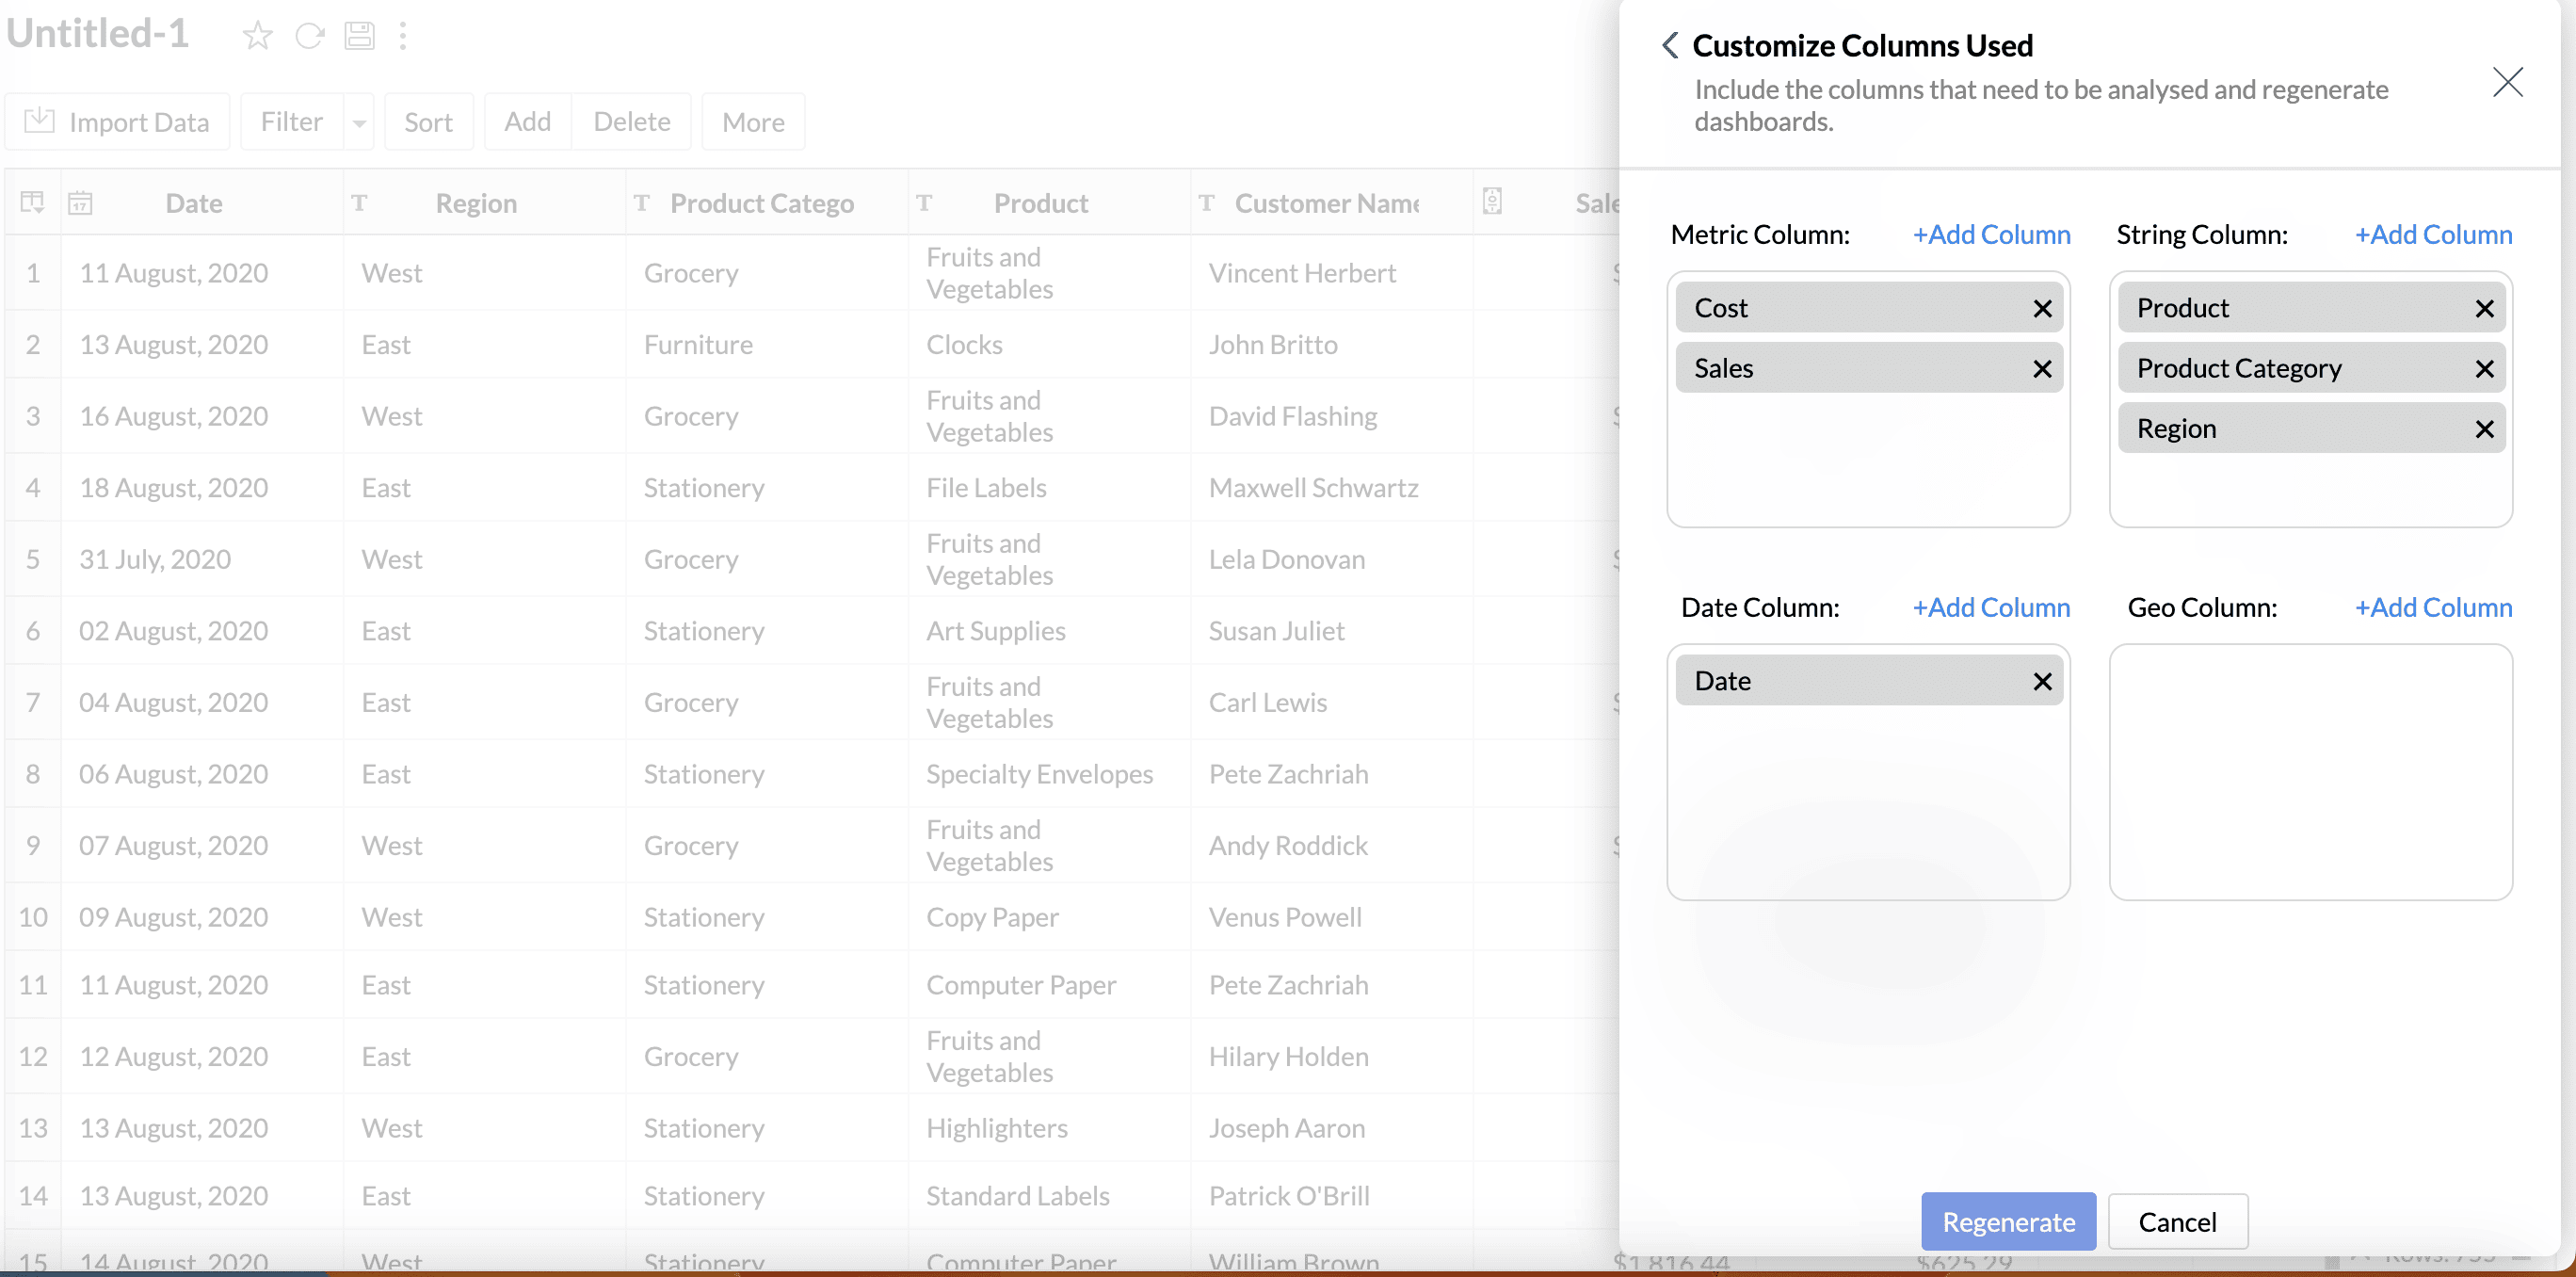
- Click Regenerate to view the dashboards created using the selected columns. Reset allows you to revert to original settings.
Finally, select the dashboards that need to be added to the workspace and click Save.
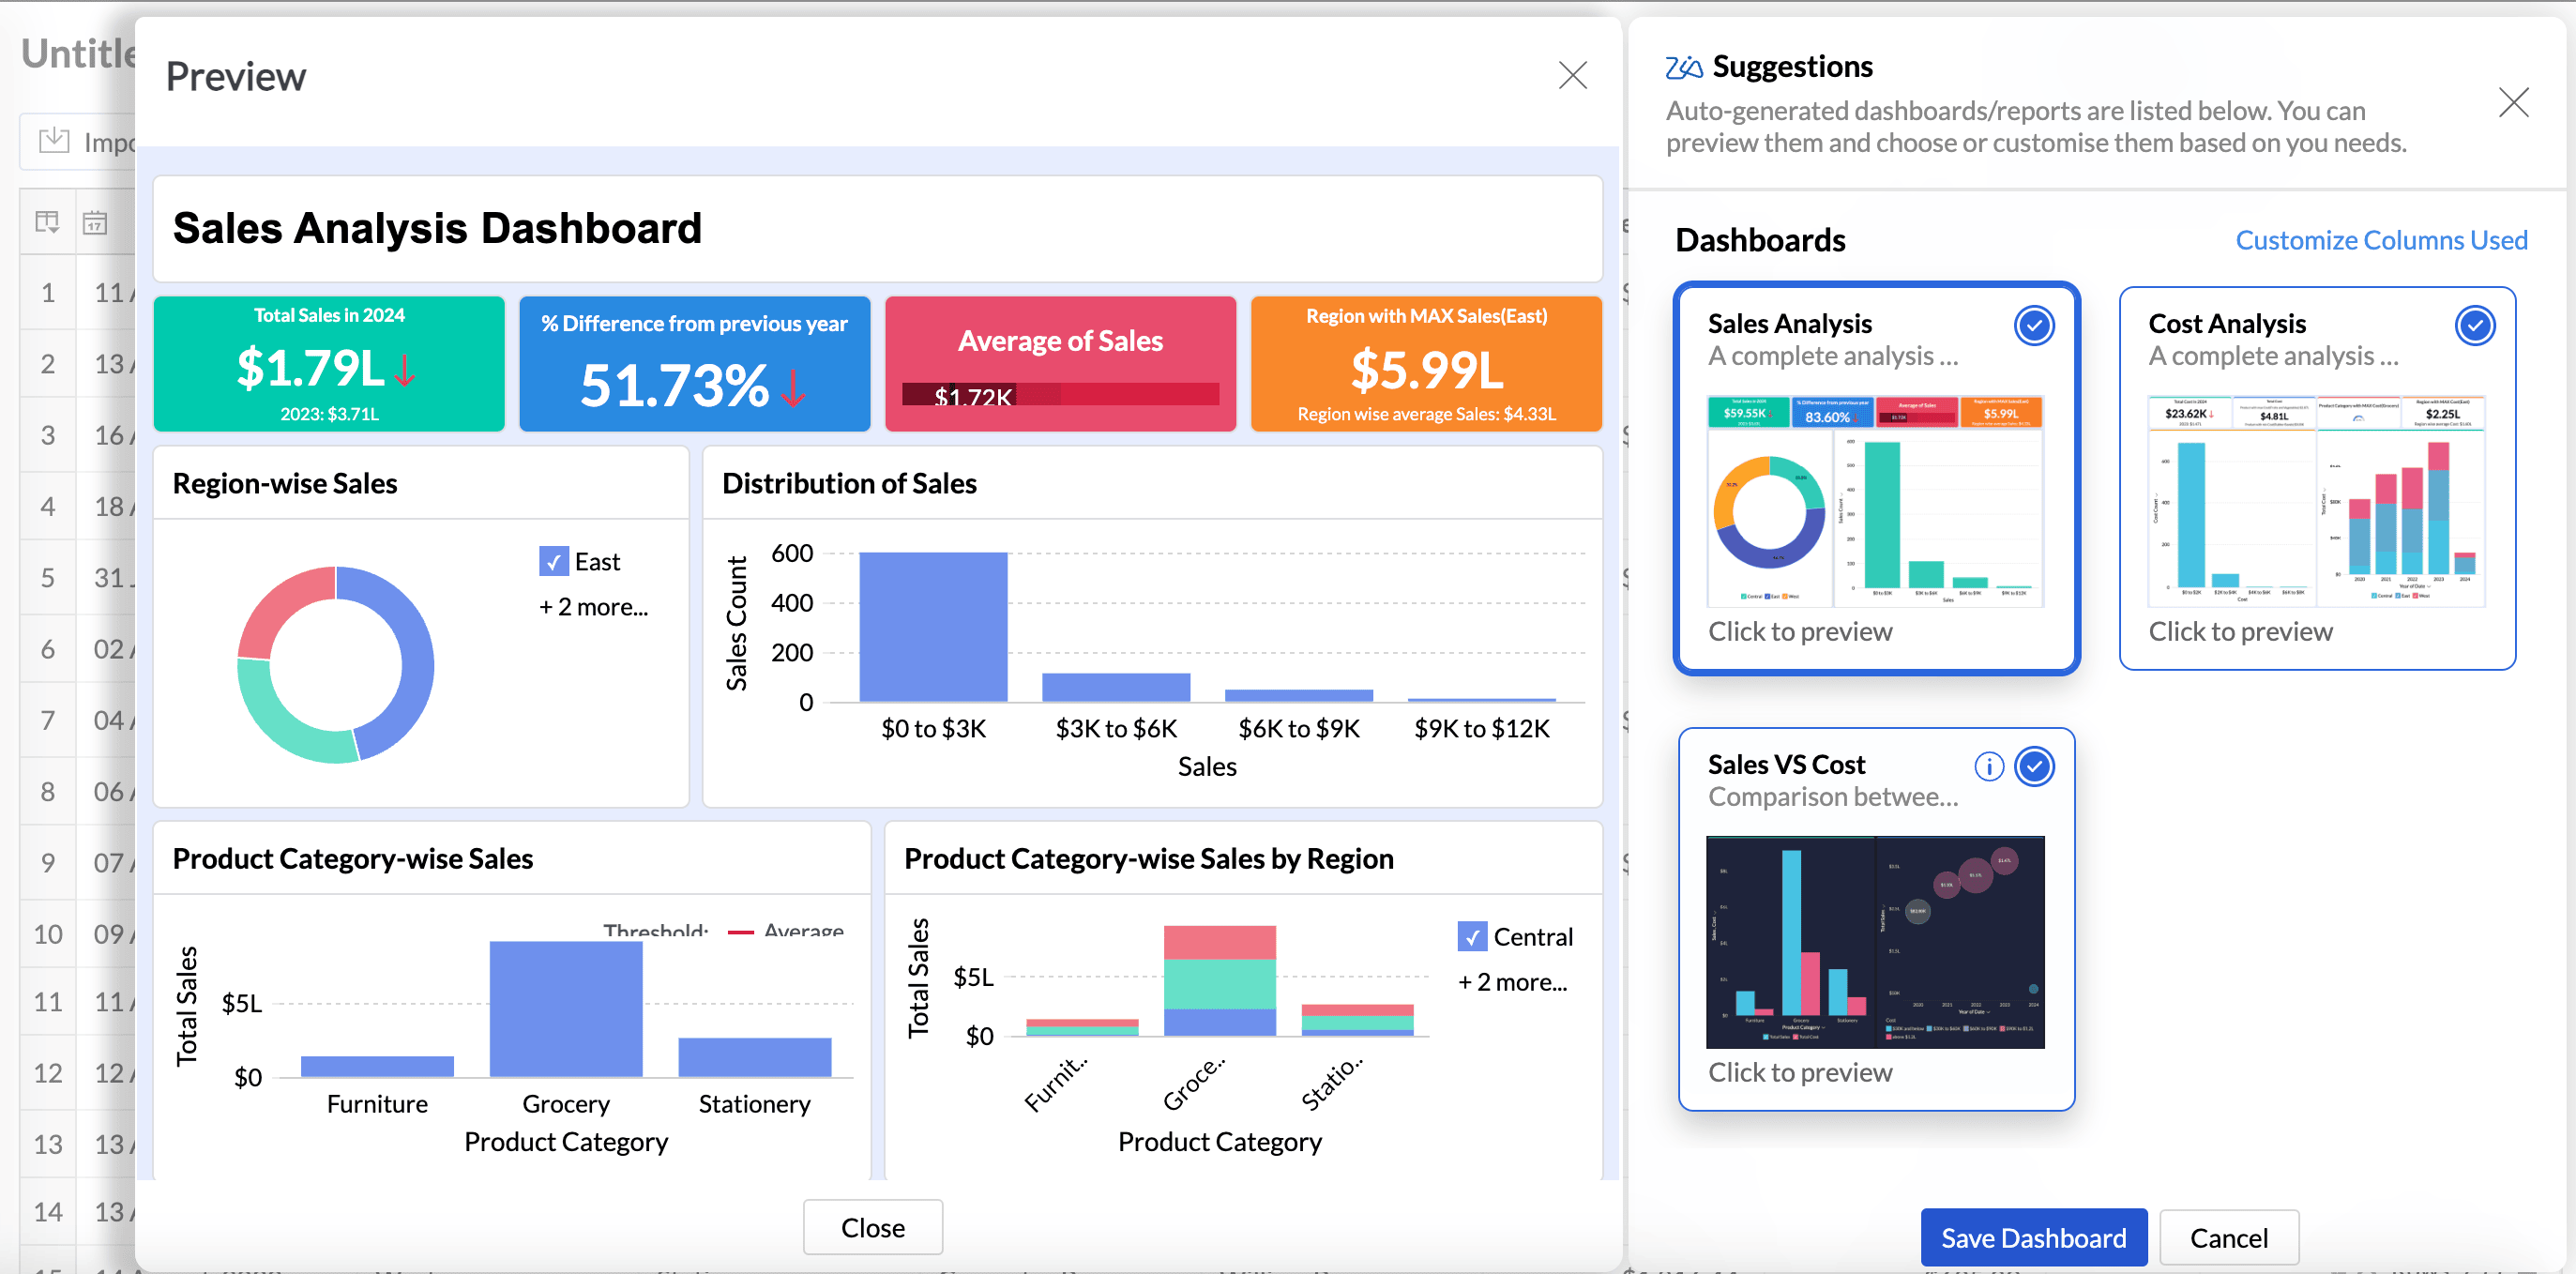
The selected dashboards will be saved to the workspace, and the reports will be listed in folders for easy access. You can then edit or modify the reports and dashboards as needed.
Auto Analysis for Multiple tables
Zoho Analytics automatically generates reports by considering multiple tables based on the data model diagram. It analyzes the defined lookup relationships to identify the base table, from which the required measures and dimensional columns are selected. Additional descriptive dimension columns required for the analysis are then sourced from the related dimension tables, ensuring accurate joins and meaningful analytical results.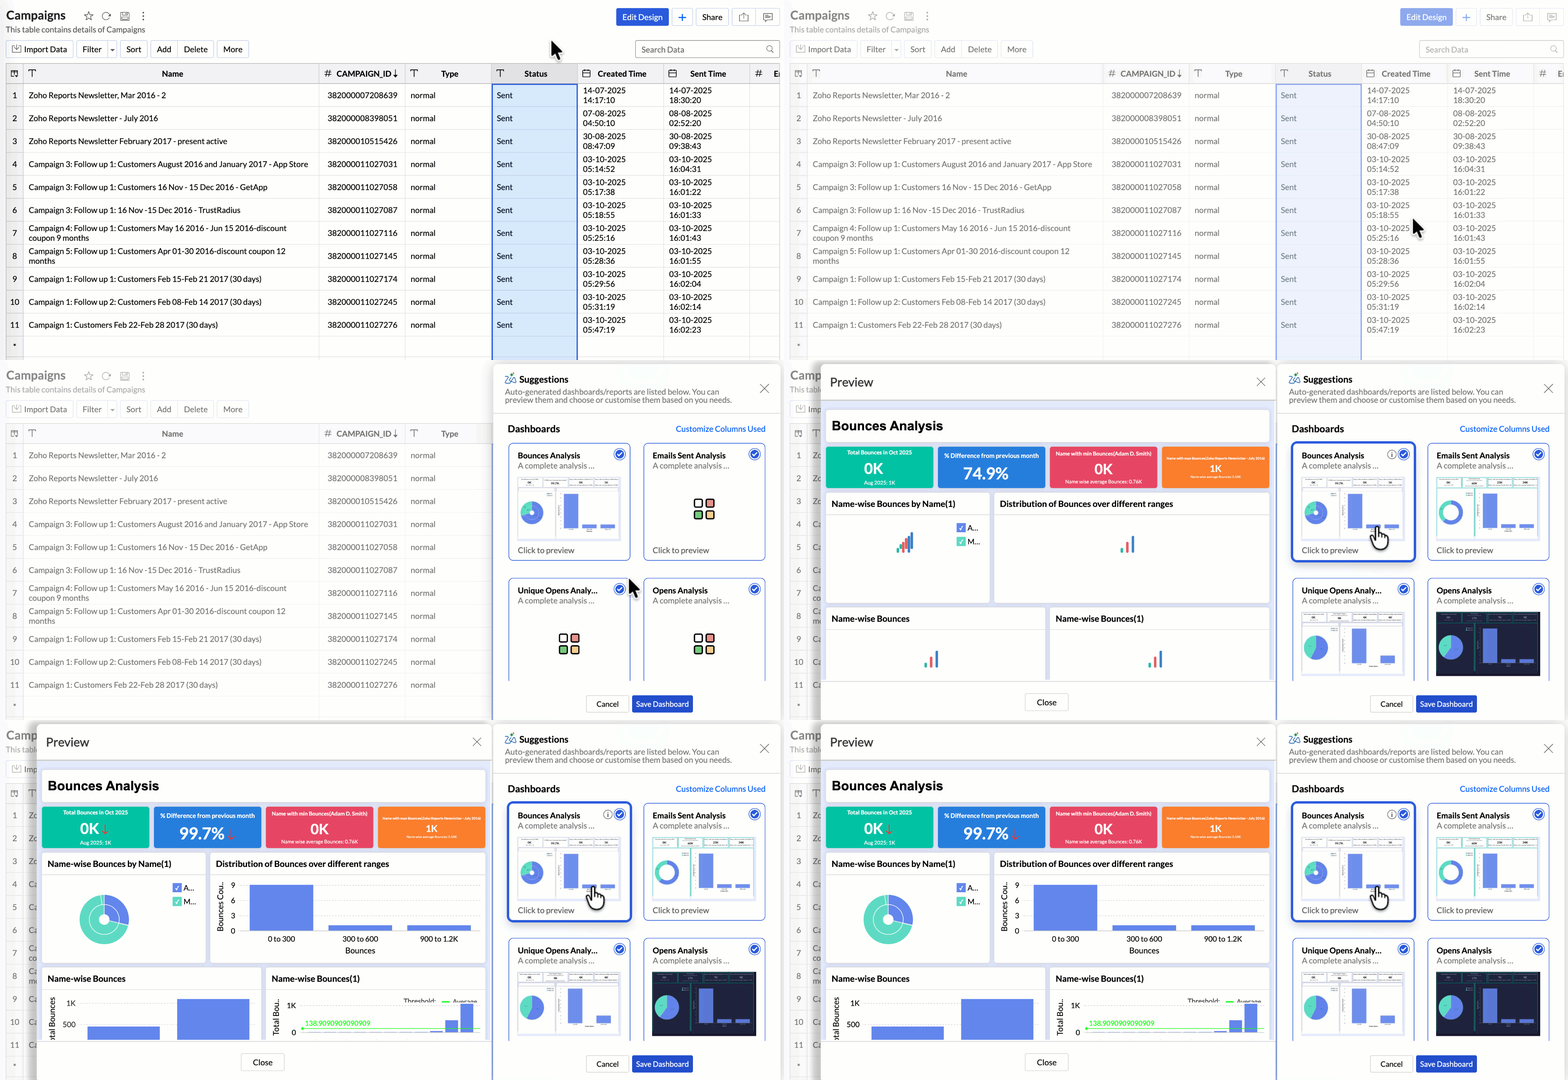
How are the Tables and Columns selected for auto analysis?
During auto analysis, Zoho Analytics traverses the data model starting from the base table and follows valid dimensional paths defined by lookup relationships. Only tables that form a continuous, hierarchical join path contributing directly to the analytical context are considered.
Existing Table in Zoho Analytics
You can also auto-generate reports for an existing table in Zoho Analytics. To auto-generate reports for an existing table, follow the below steps:
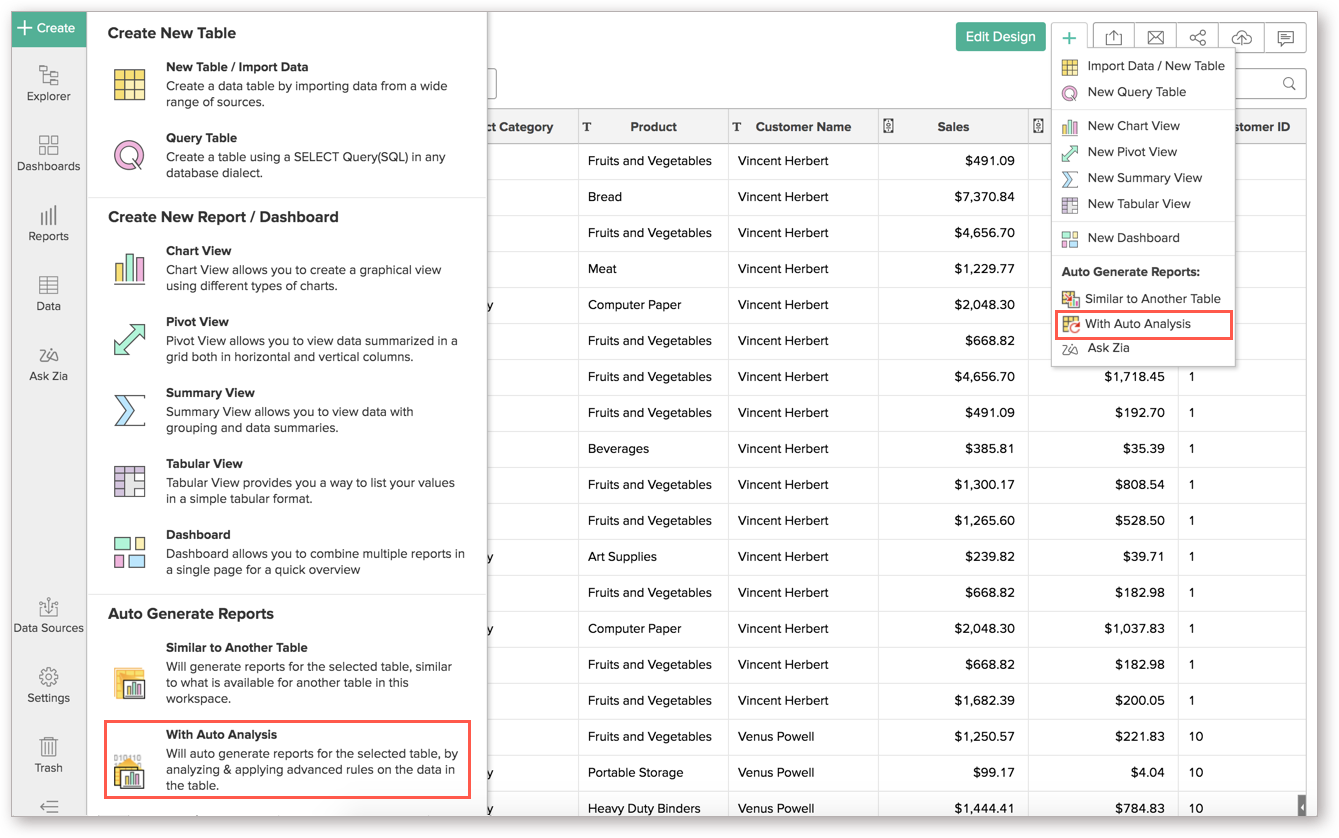
- From the table for which you are auto-generating reports and dashboards, click Create > With Auto Analysis or New icon > With Auto Analysis.
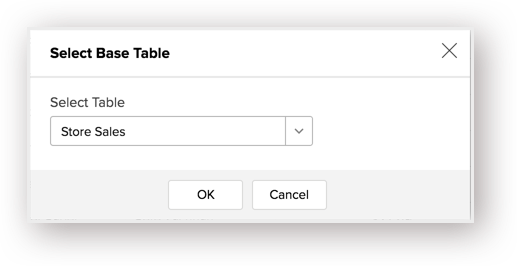
- In the Select Base Table dialog that opens, select the table name for which you wish to auto-generate reports and click OK.
On successful creation of reports and dashboards, you will get a "Reports Successfully Auto Generated" message along with the most relevant dashboard opened for preview.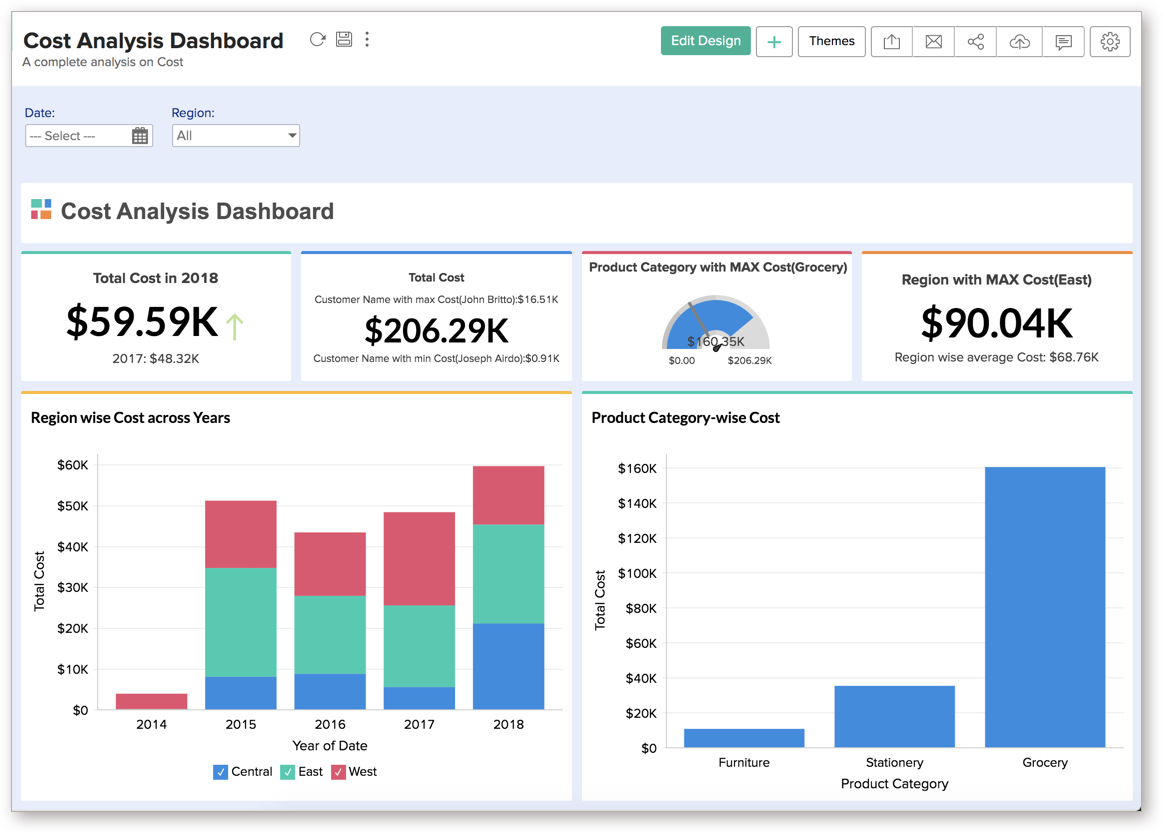
The reports will be neatly organized inside folder(s) with a temporary tag "Newly Auto Generated Reports." As with any other reports, you can edit/customize these reports and dashboards too, any time.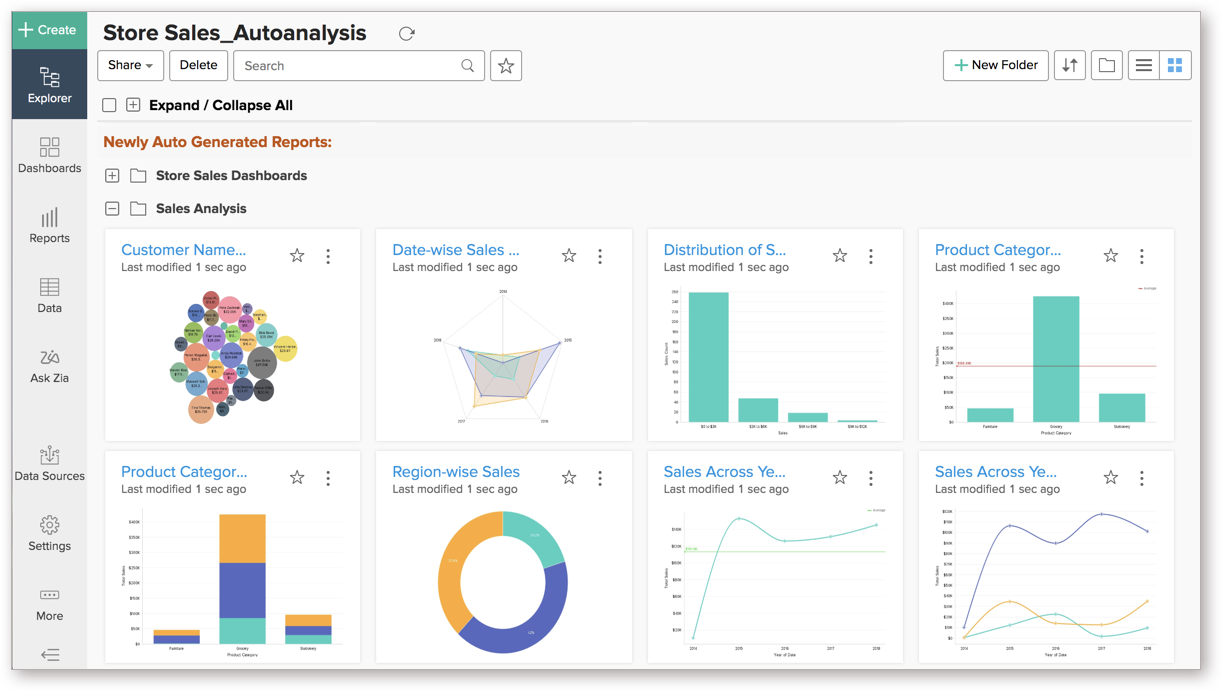
Note:
- As with any other reports, you can edit/customize the auto-generated reports too, any time. Click the respective links to learn more about creating and customizing reports and dashboards.
Similar to Another Table
In many circumstances, you might have a similar data set, like that of an existing one, imported into Zoho Analytics. You might want to create reports on the new data set similar to the ones already available. In such scenarios, you can use "Similar to Another Table" option for easy report recreation.
"Similar to Another Table" is a handy feature, which helps you to create similar reports on a table that is structurally similar to another table within a workspace.
Pre-requisites
When you have to use the "Similar to Another Table" option on a data set, the following criteria have to be met:
- Both the tables (the source table and the destination table) must be structurally similar i.e., the destination table should have the same column names and same data types as that of the source table.
- The columns over which the reports are created in the source table must be available in the destination table as well. If the destination table has extra columns that are not in the source table, the reports will be generated only for the columns present in the source table.
How to generate reports using the Similar to Another Table option?
Follow the below steps to generate reports and dashboards for a table similar to another table within a workspace,
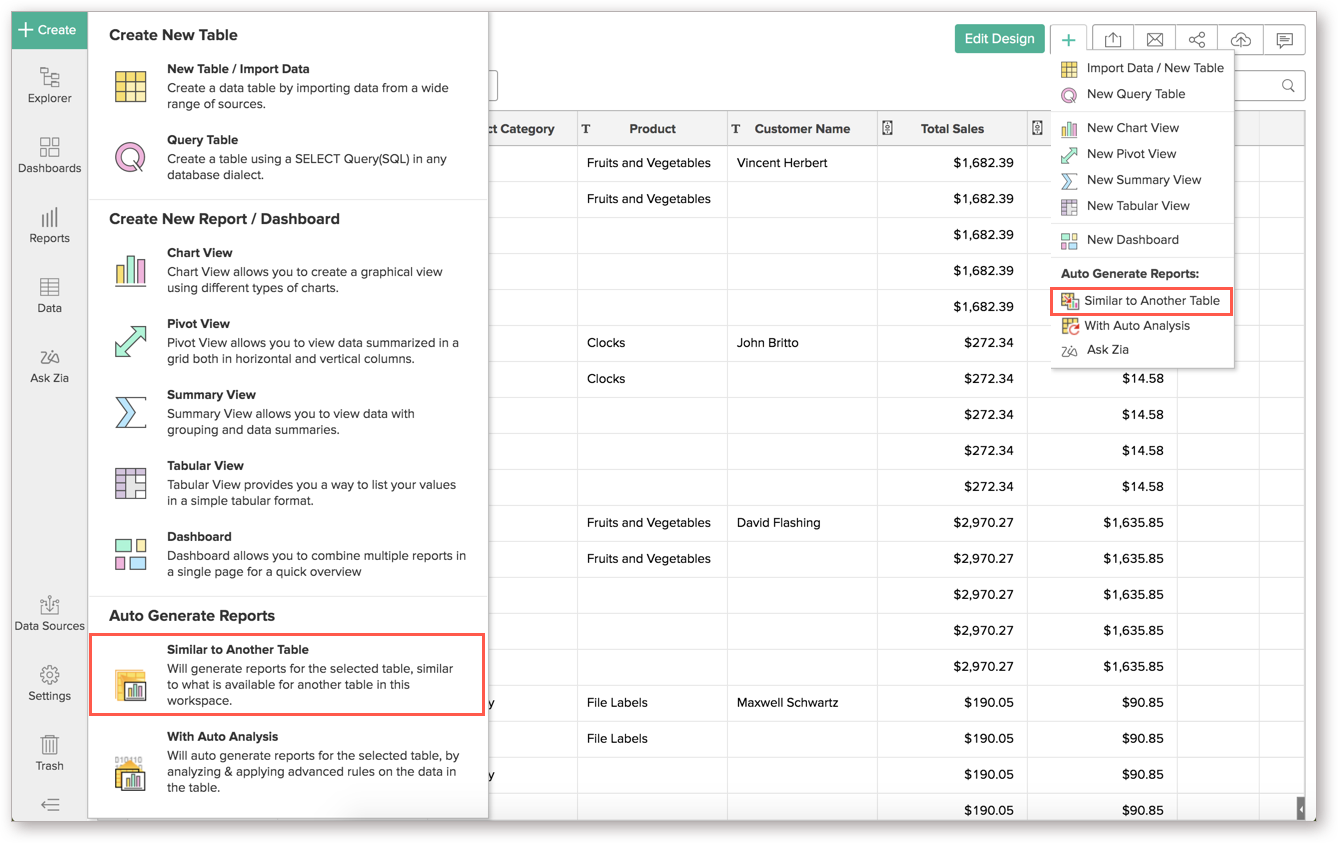
- From the table for which you are generating reports, click Create > Similar to Another Table or New icon > Similar to Another Table.
- In the Select Table for Report Generation dialog that opens, provide the following information:
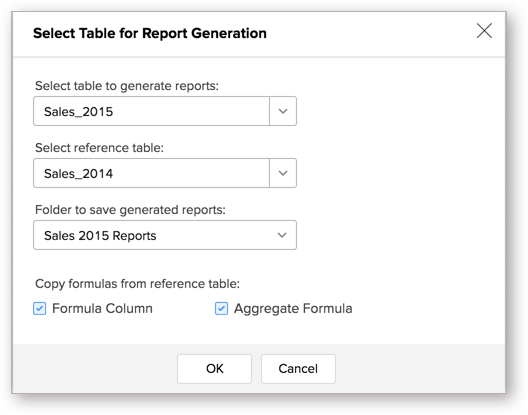
- Select table to generate reports: Select the table for which you would like to create reports.
- Select reference table: Select the source table whose reports and dashboards you wish to recreate.
- Folder to save generated reports: Provide a destination folder where the reports must be saved.
- Copy formulas from reference table: In case formula columns have been created over the source table, you can choose to recreate the same in the destination table as well by clicking the Formula Column and/or Aggregate Formula checkboxes. To know more about adding formulas, refer to Adding Formulas documentation.
- Click OK.
On successful report creation, a Report Creation Summary dialog will appear showing the number of reports and dashboards created.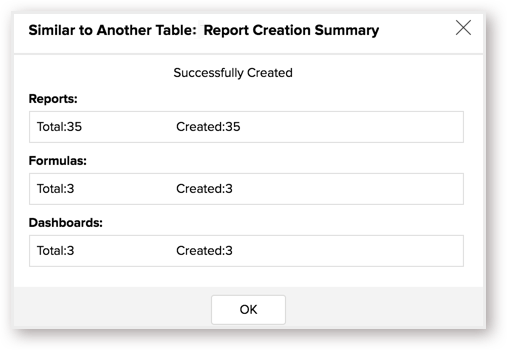
You will notice that the created reports and dashboards will be placed inside the specified folder. As with any other reports, you can edit/customize these reports and dashboards too, any time.
Note:
- You can copy the formulas created in your source table to the destination table, along with the set of reports created on them while you are recreating reports using "Similar to Another Table" option. You just have to select the formula types (Formula Column and/or Aggregate Formula) checkboxes that you wish to be recreated on the destination table and click OK.
Creating reports for two or more tables connected using lookup columns.
The below conditions should be met to use the similar to another table option
- The source tables and the destination tables should be structurally similar (same data type and column names).
- The lookup relation defined between the source tables must be defined between the destination tables as well in order to replicate the reports. For example, there are two tables A and B that act as the source Parent-Child tables. Then the same kind of lookup relation needs to be defined between the destination tables, say A' and B', to copy the reports created on A and B.
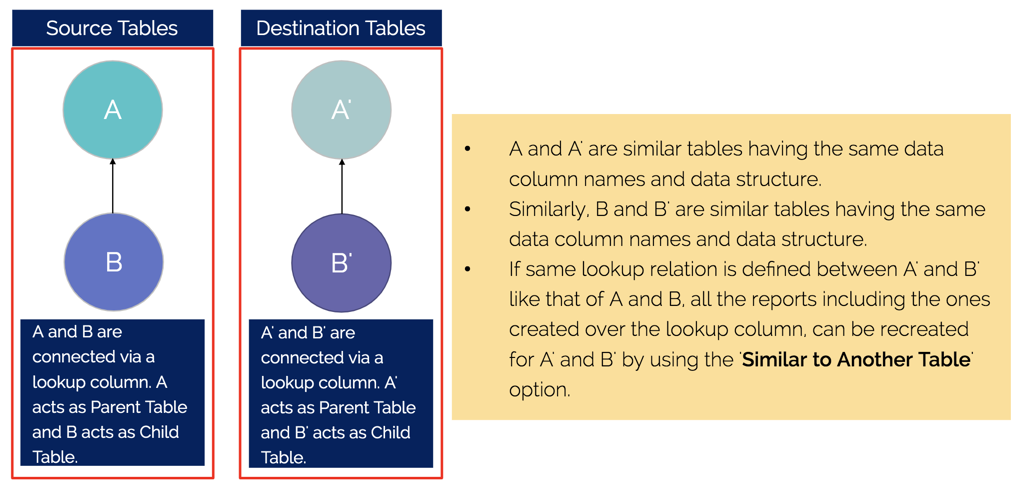
Note: As with every other case, you need to have the same lookup defined for both the Child tables with the Parent table.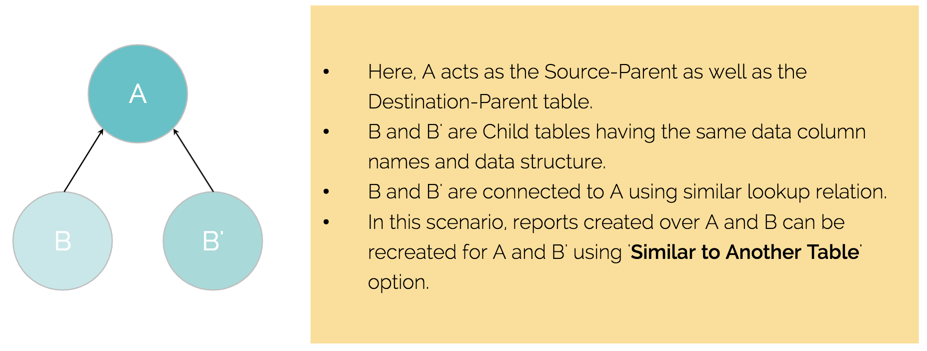
Troubleshooting Tips
1. Similar to Another Table: I get an error message "Error - Only One Table Found. Report generation not possible. Only table found in the workspace is '<Table_Name>'. Require at least another table to generate similar reports." What could be the possible reason?
This is because you have only one table in your workspace. The 'Similar to Another Table' function is possible only when two (or more) tables with the same structure are available within a workspace.
2. Similar to Another Table: I get an error message "Error - Unable to generate reports. Report generation failed due to table structure mismatch. Columns are mismatching between '<Table_Name_1>' and '<Table_Name_2>'. Please verify the column names and data types in both the tables." What could be the possible reason?
This is because your source and destination tables do not have the same structure, i.e., the same column names and data types. Ensure that the source and destination tables have the same structure with the column names matching as well. Refer to Similar to Another Table section for more details.


