Customizing a Tabular View
You can modify your Tabular View - format, sort, apply themes, and tailor it to your needs with our wide range of customization options.
In this section, we will discuss the various customization options available in a Tabular View:
Format a Column
Zoho Analytics offers options to change the format of a column like an alignment, decimal places, date formats, currency symbol etc., depending on its data type. Using these options you can choose how you would like to have your column data displayed in your Tabular View.
To format a column in your Tabular View,
- Open the Tabular View in View Mode.
- Select a cell/column and click Format Column from the drop-down. Alternatively, you can also format a column by selecting the required cell and clicking Format > Format Column from the toolbar available at the top of your Tabular View.
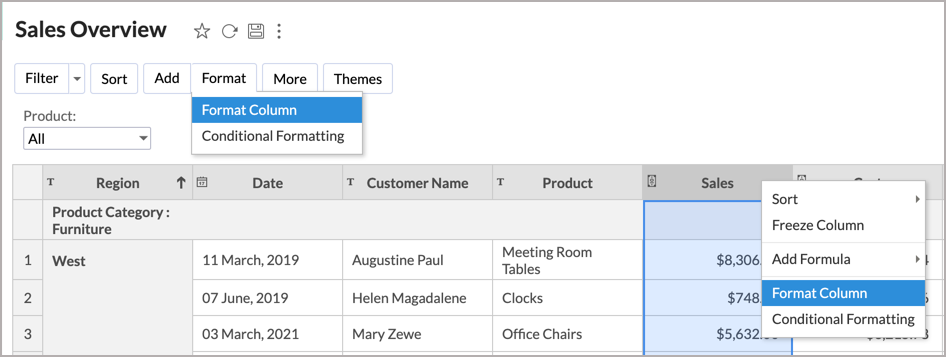
- You can make the necessary formatting changes in the Format Column dialog that opens. As shown in the below screenshots, the formatting options vary based on the data type of the selected column.
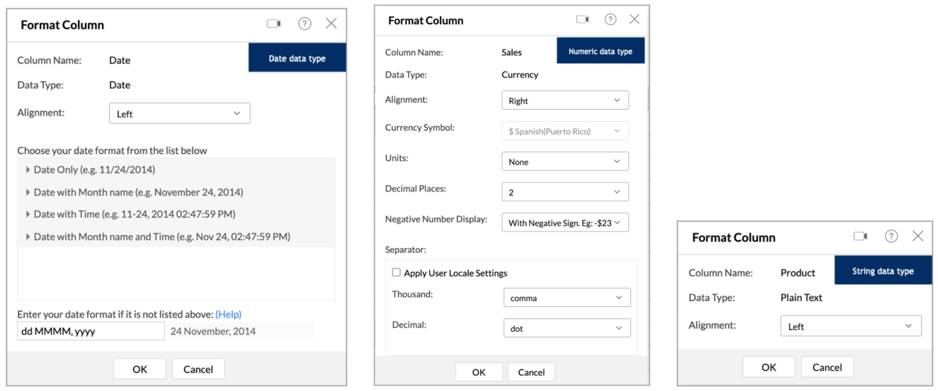
Read more about formatting options.
Wrap and Clip Headers
The Wrap and Clip option helps determine how the text should be displayed when it exceeds the available space in a cell.
- Wrap: Displays the text as multiple lines within a cell to ensure the entire content is visible without truncation. This can be used for long header names to keep all the content visible while having a clean layout.
- Clip: Displays only the text that fits within the cell, truncating the rest. This is ideal in dashboards where the space is limited and headers need to be concise.
Follow the below steps to apply the wrap or clip option,
- Drag and drop the required columns into the respective shelves.
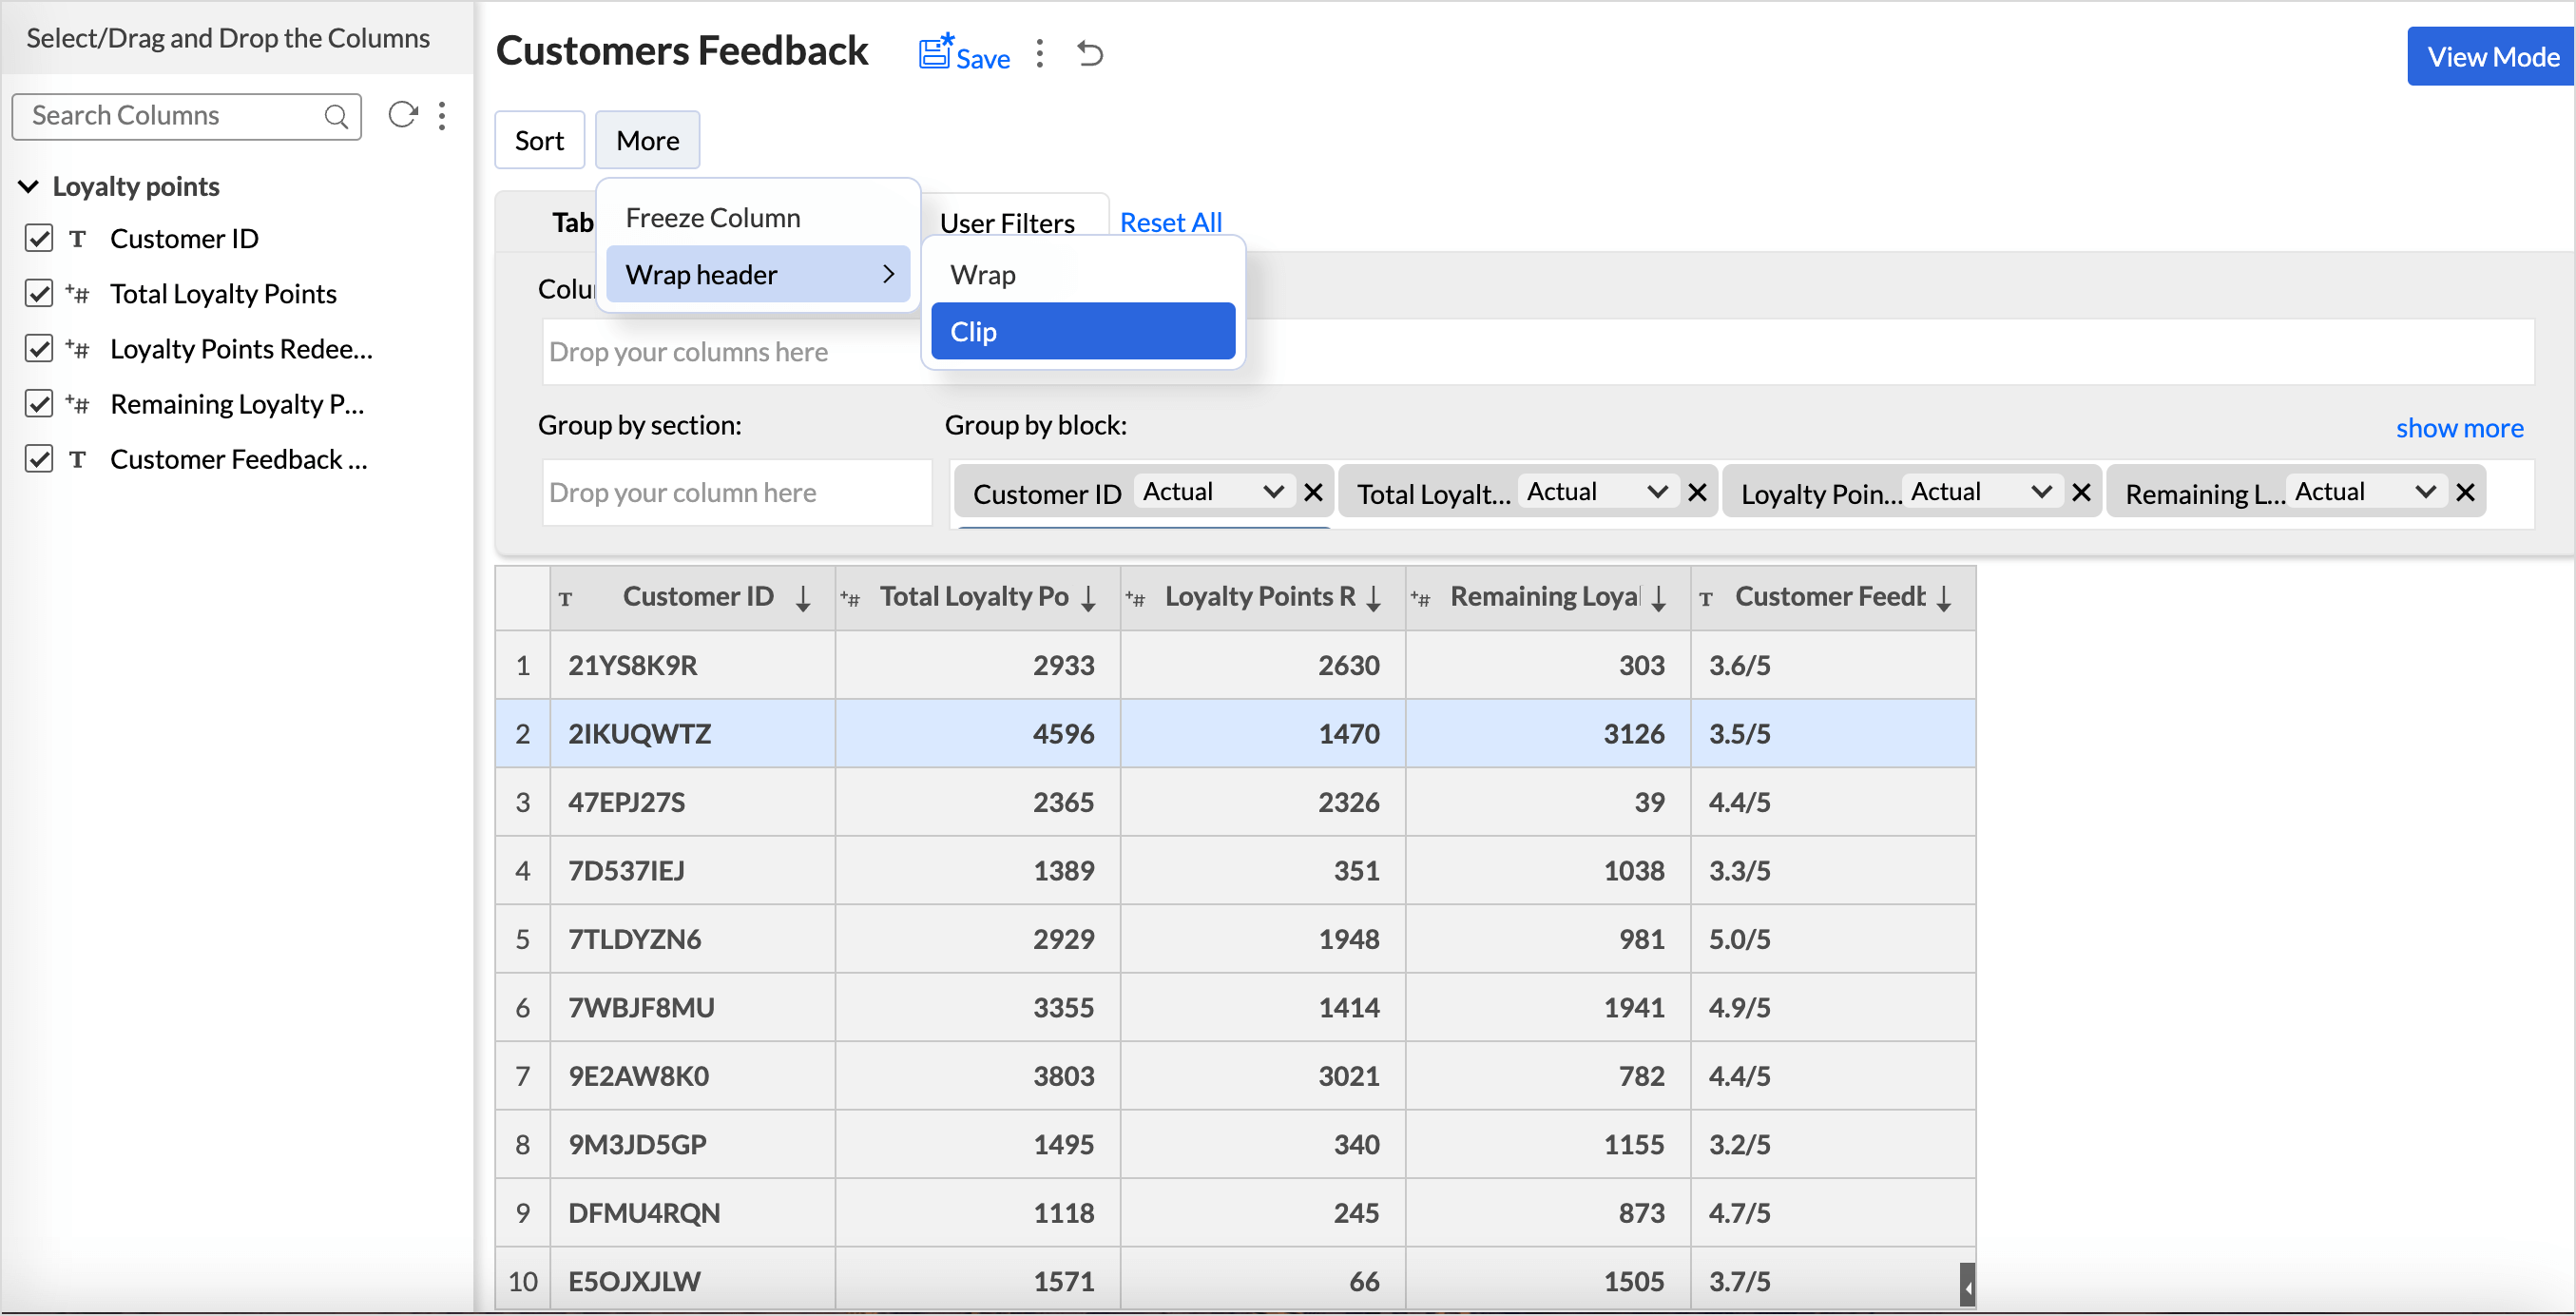
- Click the More option above the chart designer and Wrap Header from the drop-down menu.
- Choose the Wrap option to display the headers as multiple lines.
- Choose the Clip option to display only a portion of the header. The clip option is applied by default.
Conditional Formatting
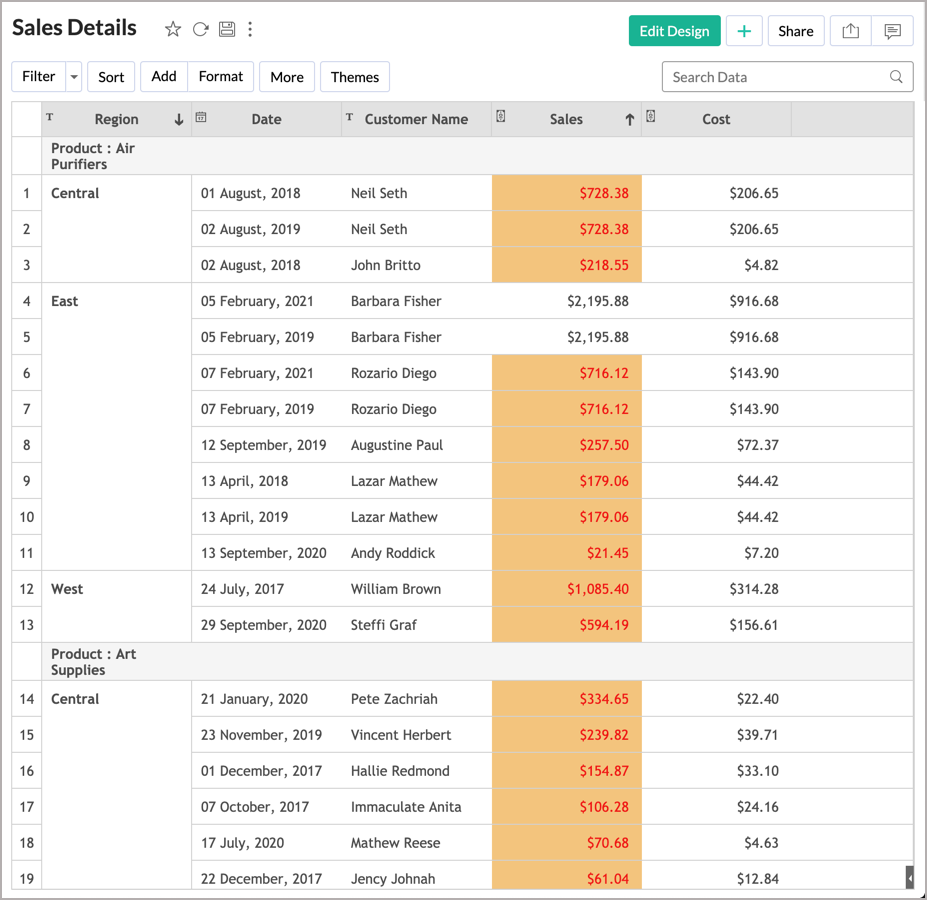
Conditional formatting allows you to highlight cells in a column with different backgrounds and font colors based on a condition. You can specify a condition/criteria for formatting and when data in a cell meets the condition, Zoho Analytics applies the corresponding formatting style that you have specified.
Conditional formatting is currently supported in Tables, Pivot Views, Tabular Views, and Query Tables.
To apply conditional formatting to your Tabular View data:
- Right-click on any of the cells in the Tabular View for which you want to apply conditional formatting and click Conditional Formatting from the drop-down. Alternatively, you can click Format > Conditional Formatting from the toolbar.
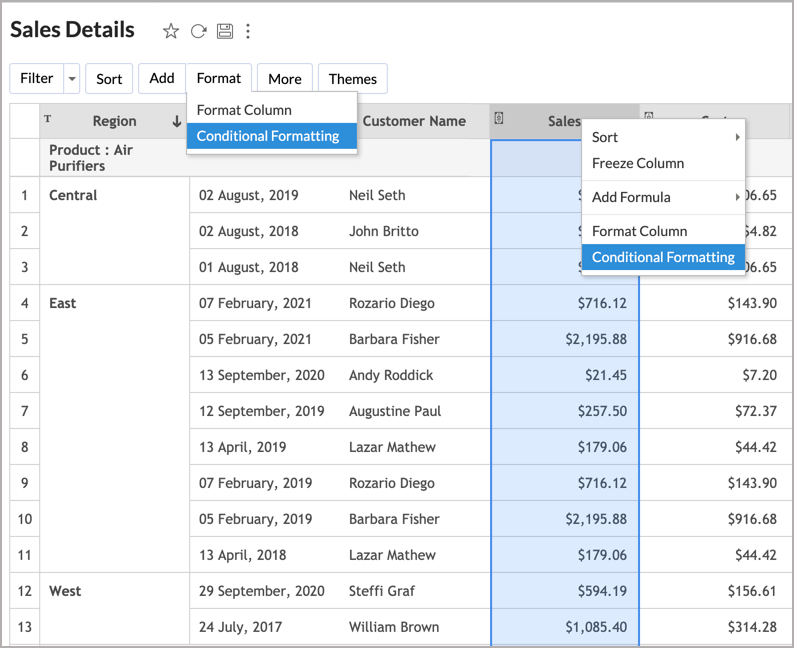
- The Conditional Formatting dialog will open. Click the drop-down box under the Condition section and select the type of condition that you want to apply. The conditions that appear here vary based on the data type on which the conditions are being applied.
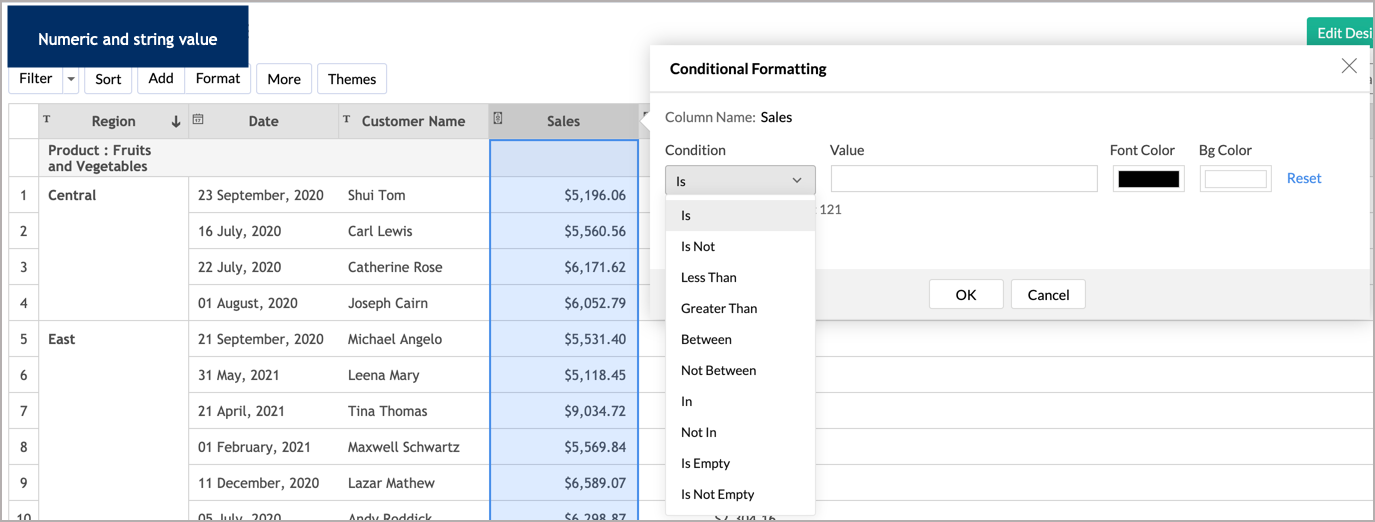
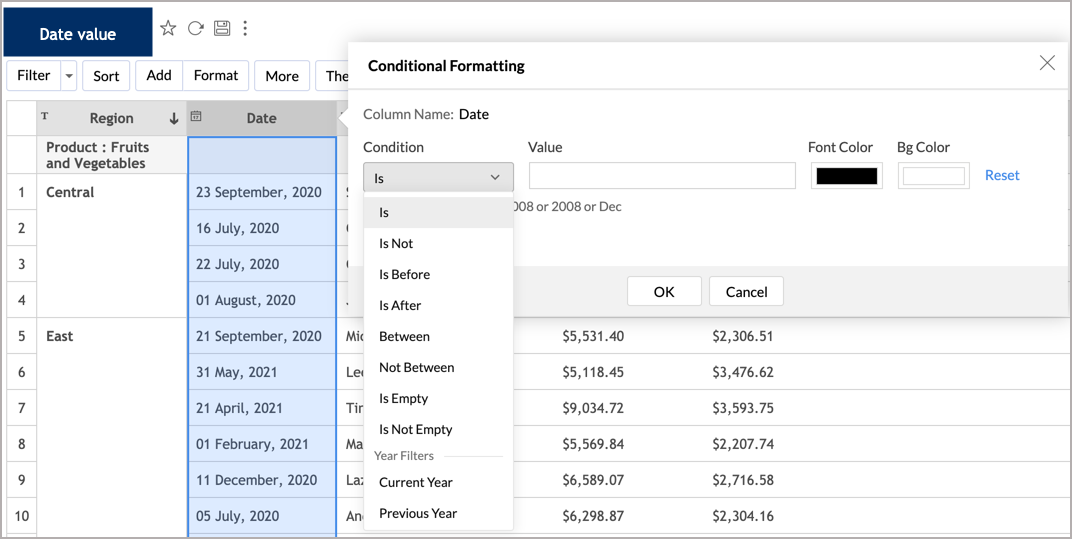
- Enter the condition or criteria value in the Value text box.
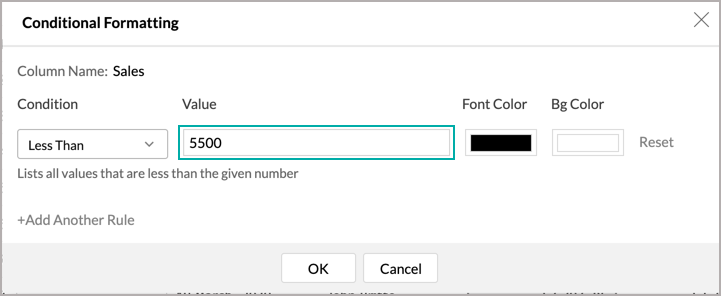
- Select the required colors for the font and background color by clicking the Font Color and Bg Color boxes.
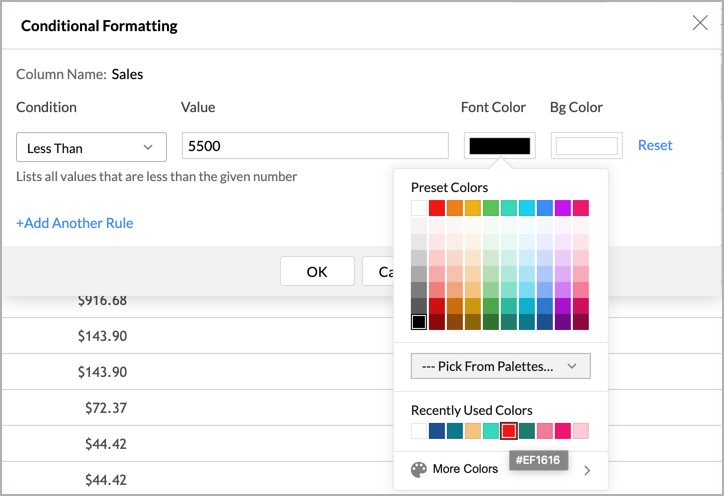
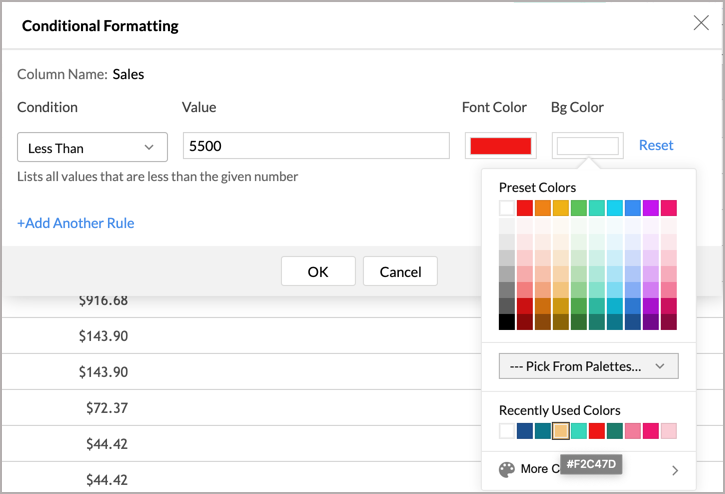
- You can add any number of conditions using the +Add Another Rule link. Specified conditions will be evaluated from top to bottom, and the corresponding formatting options will be applied on the data cell that meets the condition.
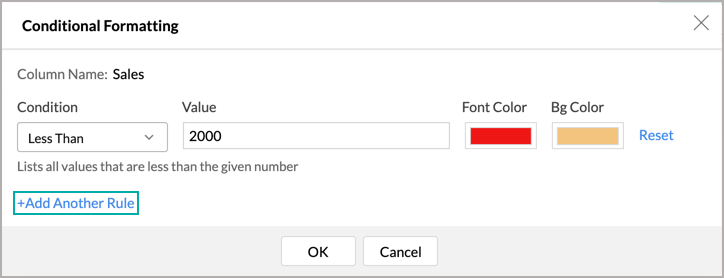
- Click OK after you have added all the conditions.
All the cells that meet the criteria will be formatted accordingly.
Applying Themes
Zoho Analytics allows you to customize the look and feel of your Tabular View using colorful and attractive themes. You can customize your Tabular View using the options provided to suit your taste. Please do note that this option is available only as a part of the new charting library that was released recently.
To change your Tabular View theme:
- Open the required Tabular View.
- Click the Themes button from the toolbar.
- The Themes dialog will list the various theme customization options available in Zoho Analytics. You can make the following modifications from this dialog,
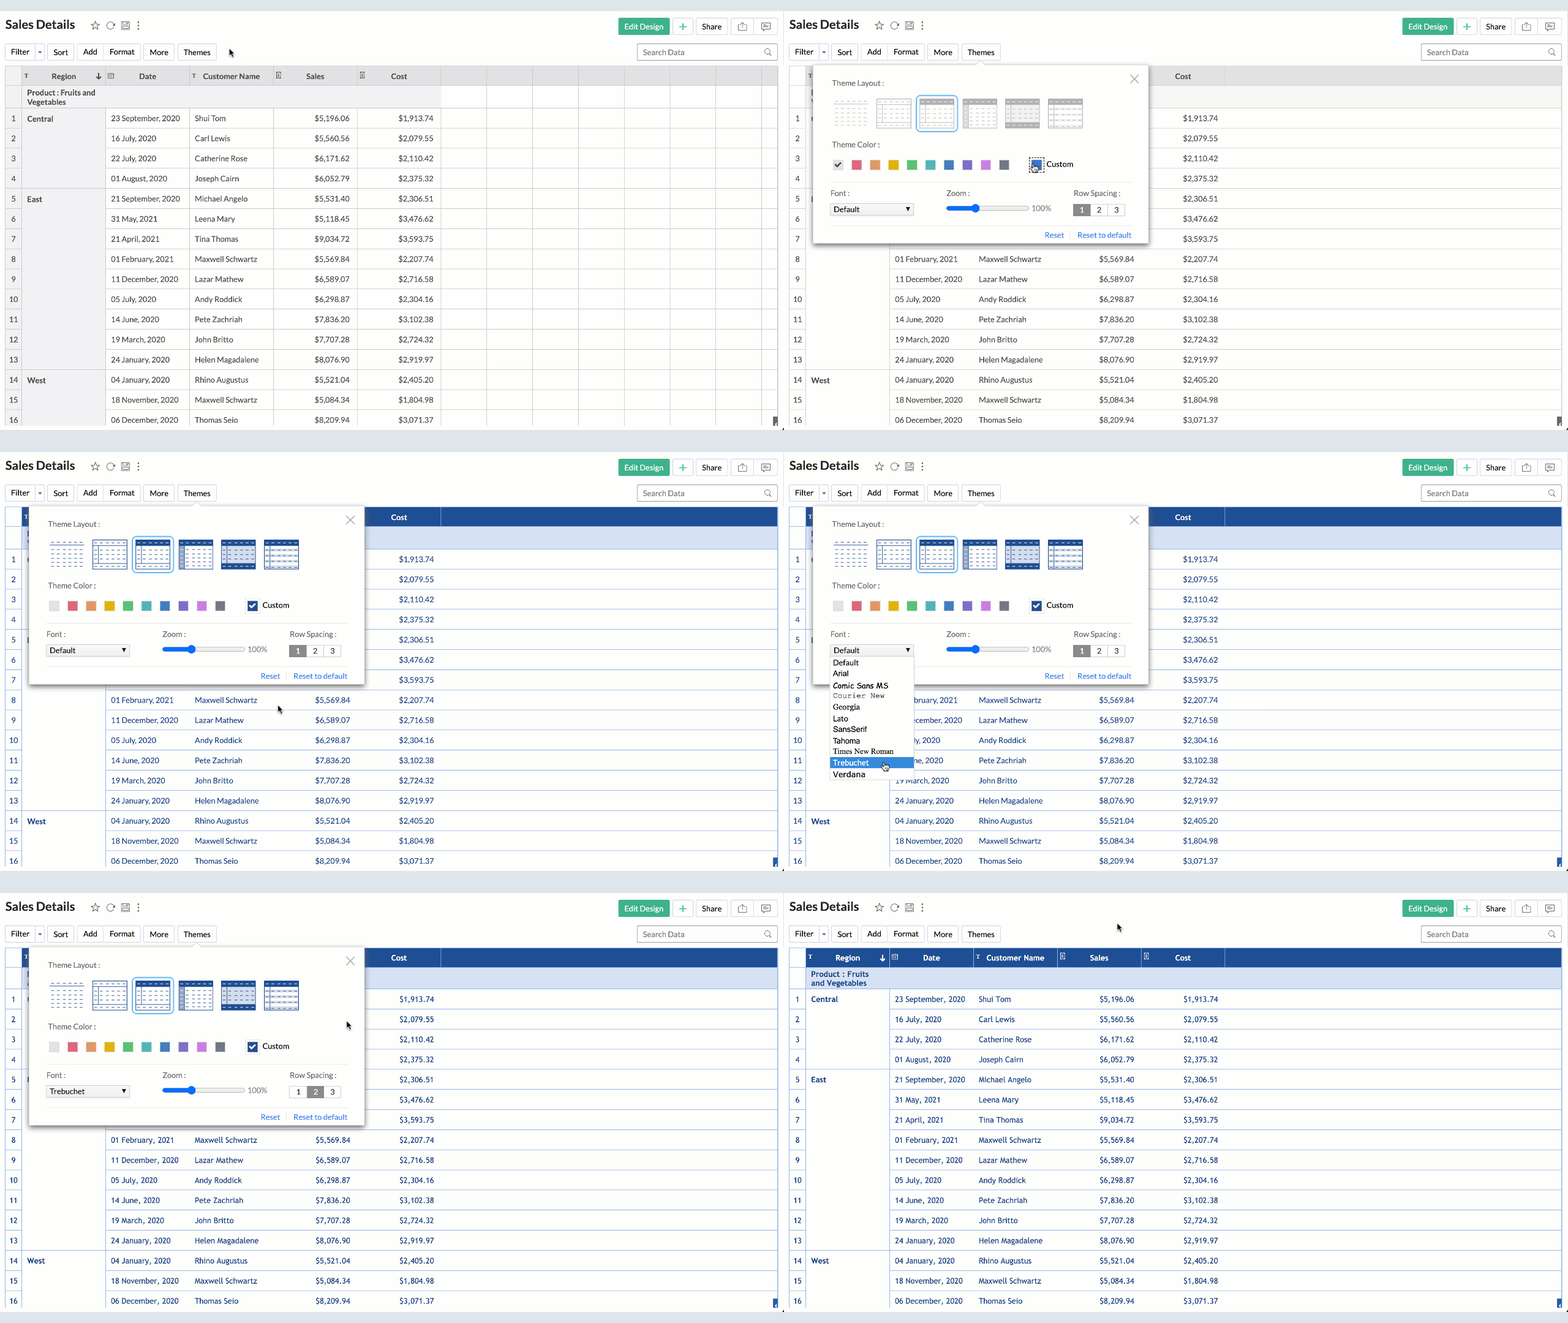
- Theme Layout: You can choose a layout from the available set of seven layouts.
- Theme Color: Select a color that you wish to apply.
- Font: Select the font for the text in your Tabular View.
- Zoom: You can Zoom in or Zoom out. This will increase or decrease the size of your Tabular View.
- Row spacing: You can alter the row spacing using the predefined options available.
- As you choose the themes, the changes will be dynamically applied in the background. If you wish to undo the changes click Reset. If you want to reset the theme to the default theme click the Reset to default option.
- Save the changes made once you are satisfied with the customizations.


